WDST User Guide
- Table of contents
Overview of the Users’ Guide
If you have any questions relating to the Web Decision Support Tool, please email: support@amhocn.org.
Background and purpose
Clinicians in public sector mental health services in all Australian states and territories are collecting information on outcomes for consumers, via a range of standardised measures that make up the National Outcomes and Casemix Collection (NOCC). These data are being collected with a view to monitoring and improving the quality and effectiveness of services, and are aggregated at the service level, then at the over-arching organisation level, then at the state/territory level and then nationally. The Australian Mental Health Outcomes and Classification Network (AMHOCN) has been charged with the task of managing, analysing and reporting, and supporting and encouraging the use of these data, in a manner that is useful to a range of stakeholders.
Key among these stakeholders are the individual clinicians who are collecting the data. Clinicians lead busy professional lives, and have shown good will and commitment in collecting outcome data to date. In order for this to continue, however, there is recognition that the data they are collecting must have direct utility for the clinical decisions they make regarding the care of individual consumers. For this reason, AMHOCN has developed a ‘Decision Support Tool (DST)’, that provides clinicians with information about consumers’ mental health status at a single point in time, and with information on whether their mental health status changes during the course of an episode of care. Clinicians can enter information about an individual consumer, and see how this consumer compares with other similar consumers in the same type of setting across the nation.
Structure of the document
This Guide has been written primarily from the perspective of an individual clinician wanting to compare the clinical profile on an individual consumer with similar characteristics and treatment settings to those in the national data set. There are, of course, other perspectives such as those of a service manager, or policy planner. The basic principles of operating the DST are similar for all these perspectives.
Operation
The NOCC WDST is located at https://data.amhocn.org/dst/web/. After accessing this link you will see:
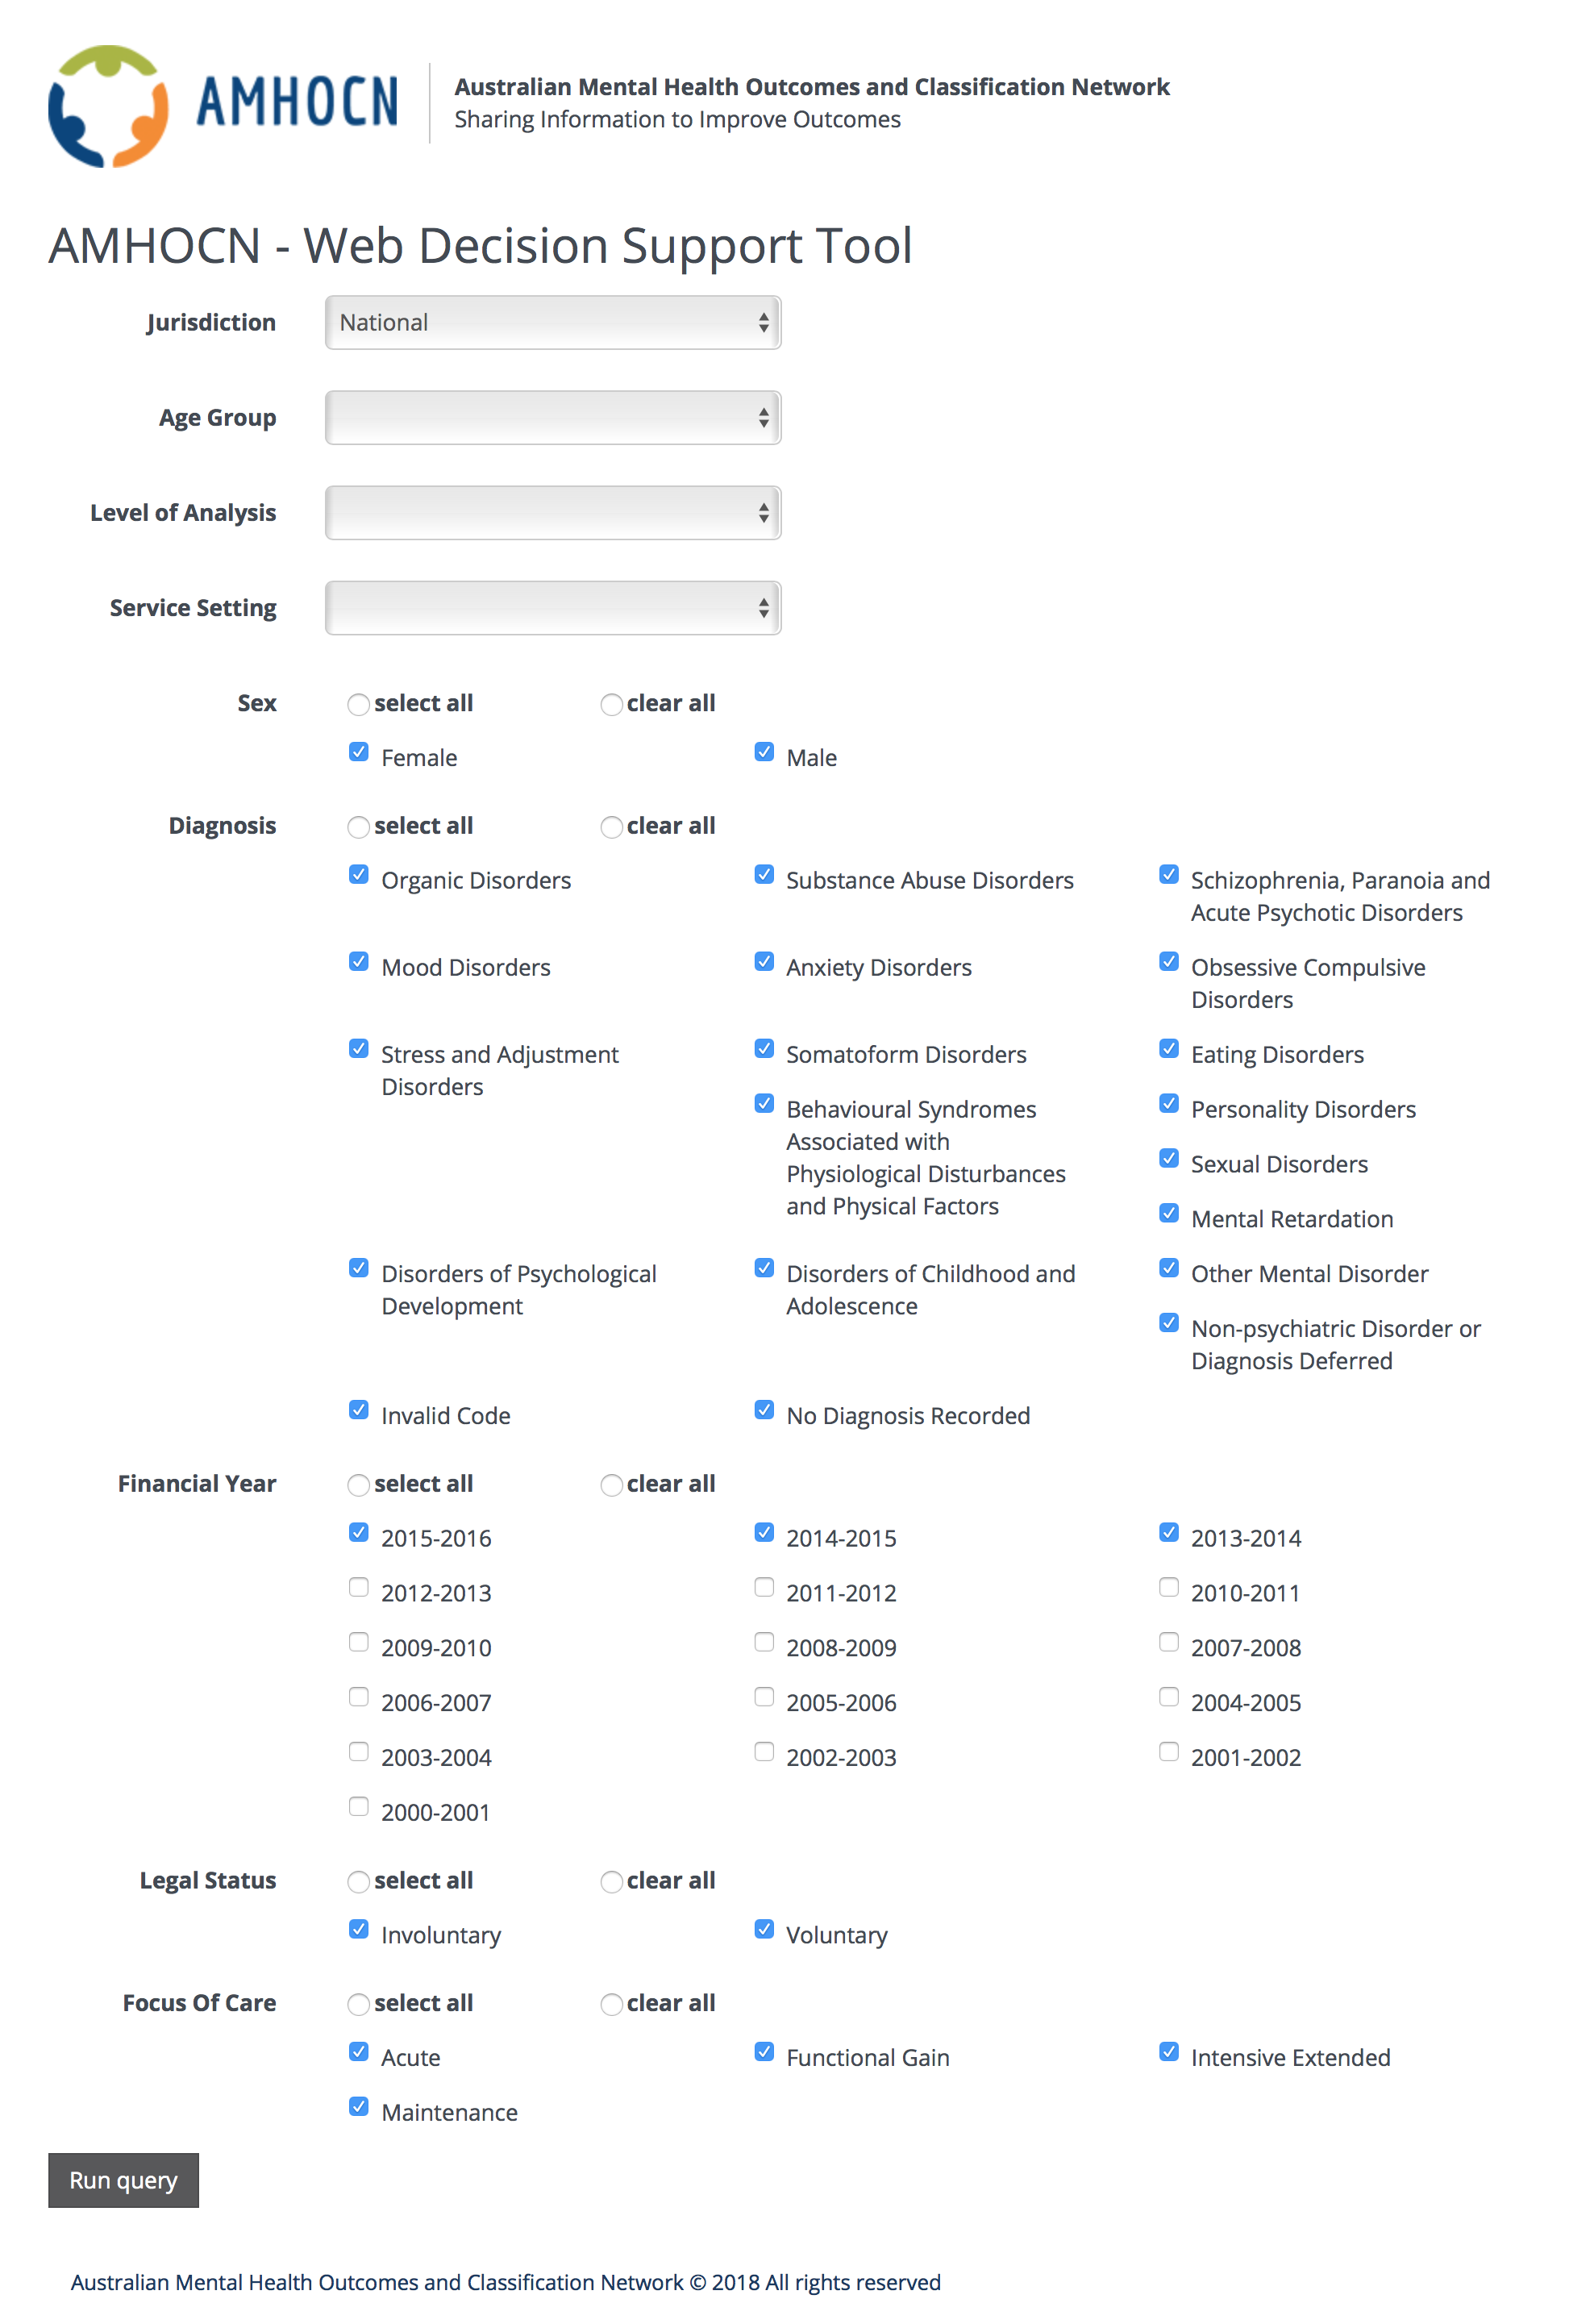
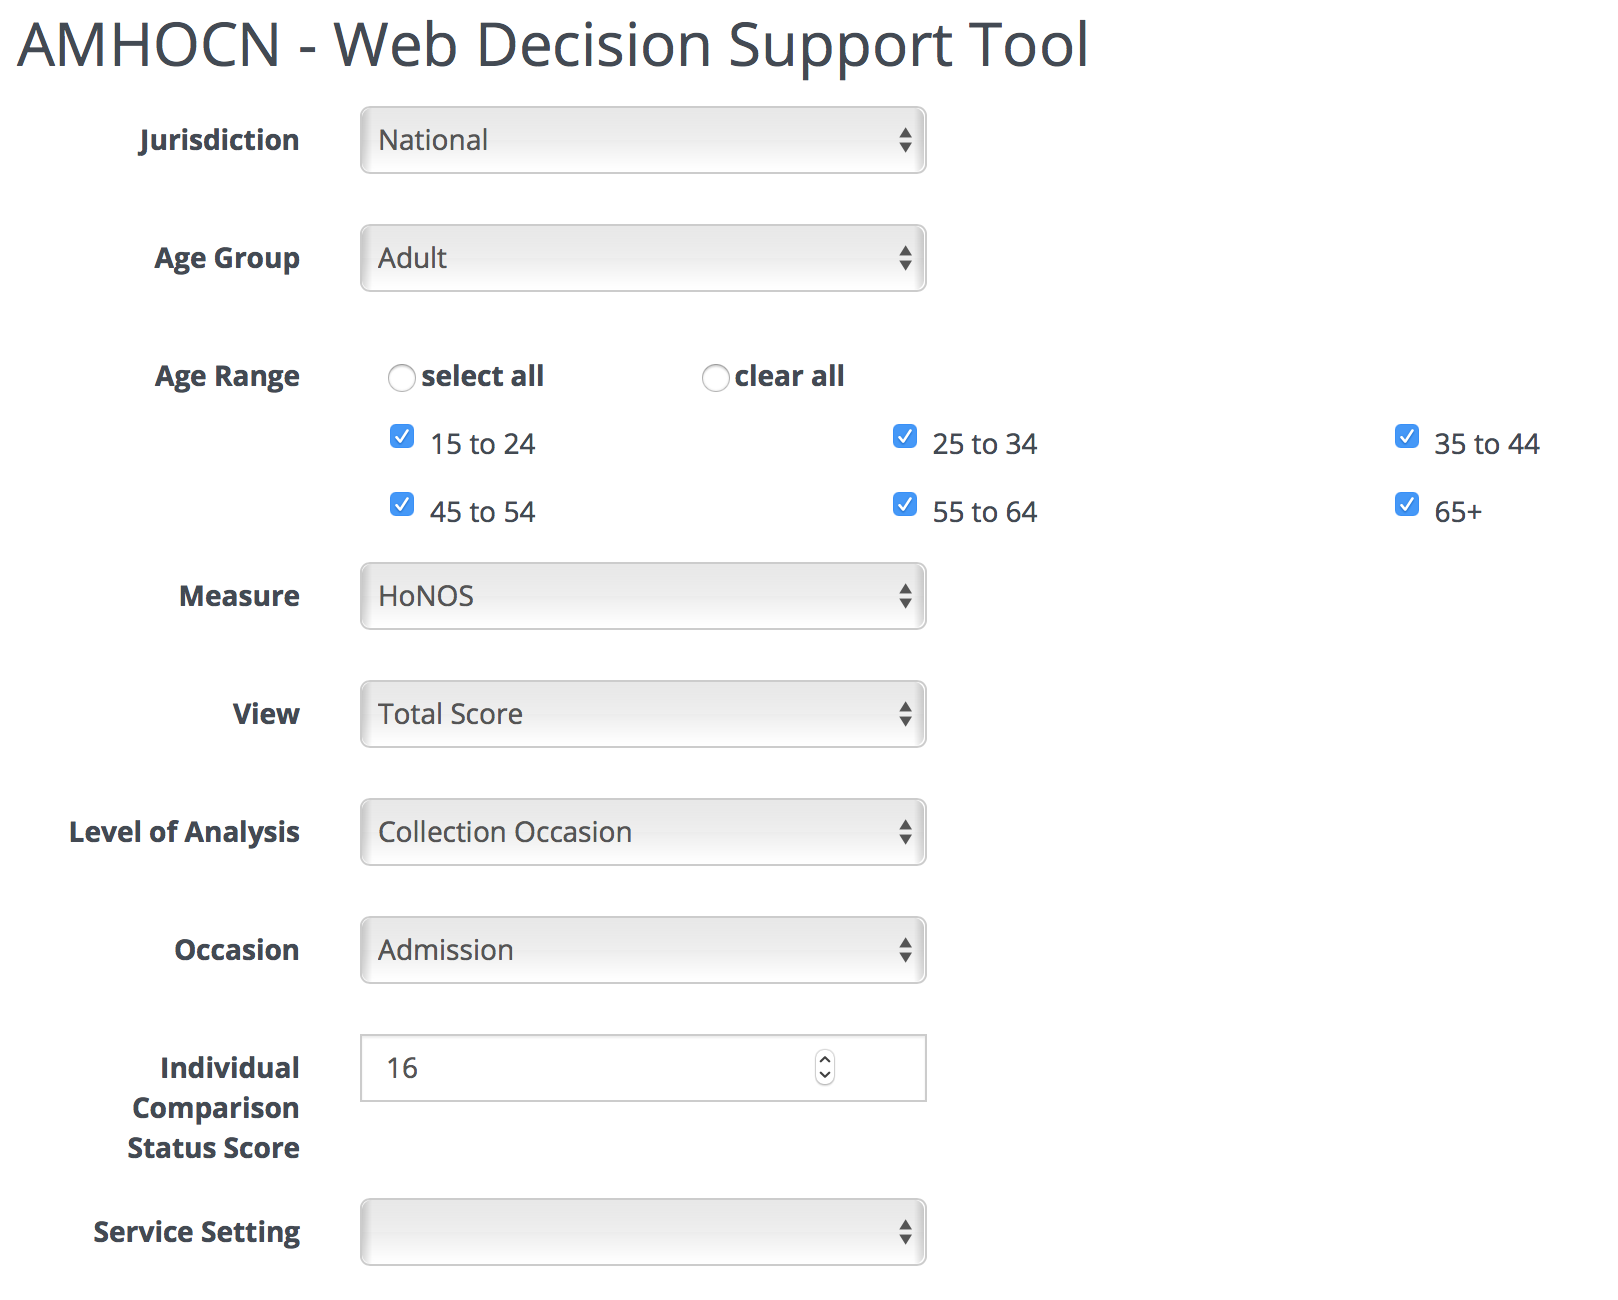
At the top of the main part of the screen you will see four drop down boxes (Jurisdiction, Age Group, Level of Analysis and Service Setting) representing the top-level criteria by which data are partitioned. You need to make a selection from each of these partitions.
Jurisdiction
The jurisdiction either be set to National or to an Australian State or Territory. The appropriate option should be selected.
Age Group
Age Group has three levels:
- Child and Adolescent
- Adult
- Older Person
Selecting any of these will bring up two more options: Age Range and Measure.
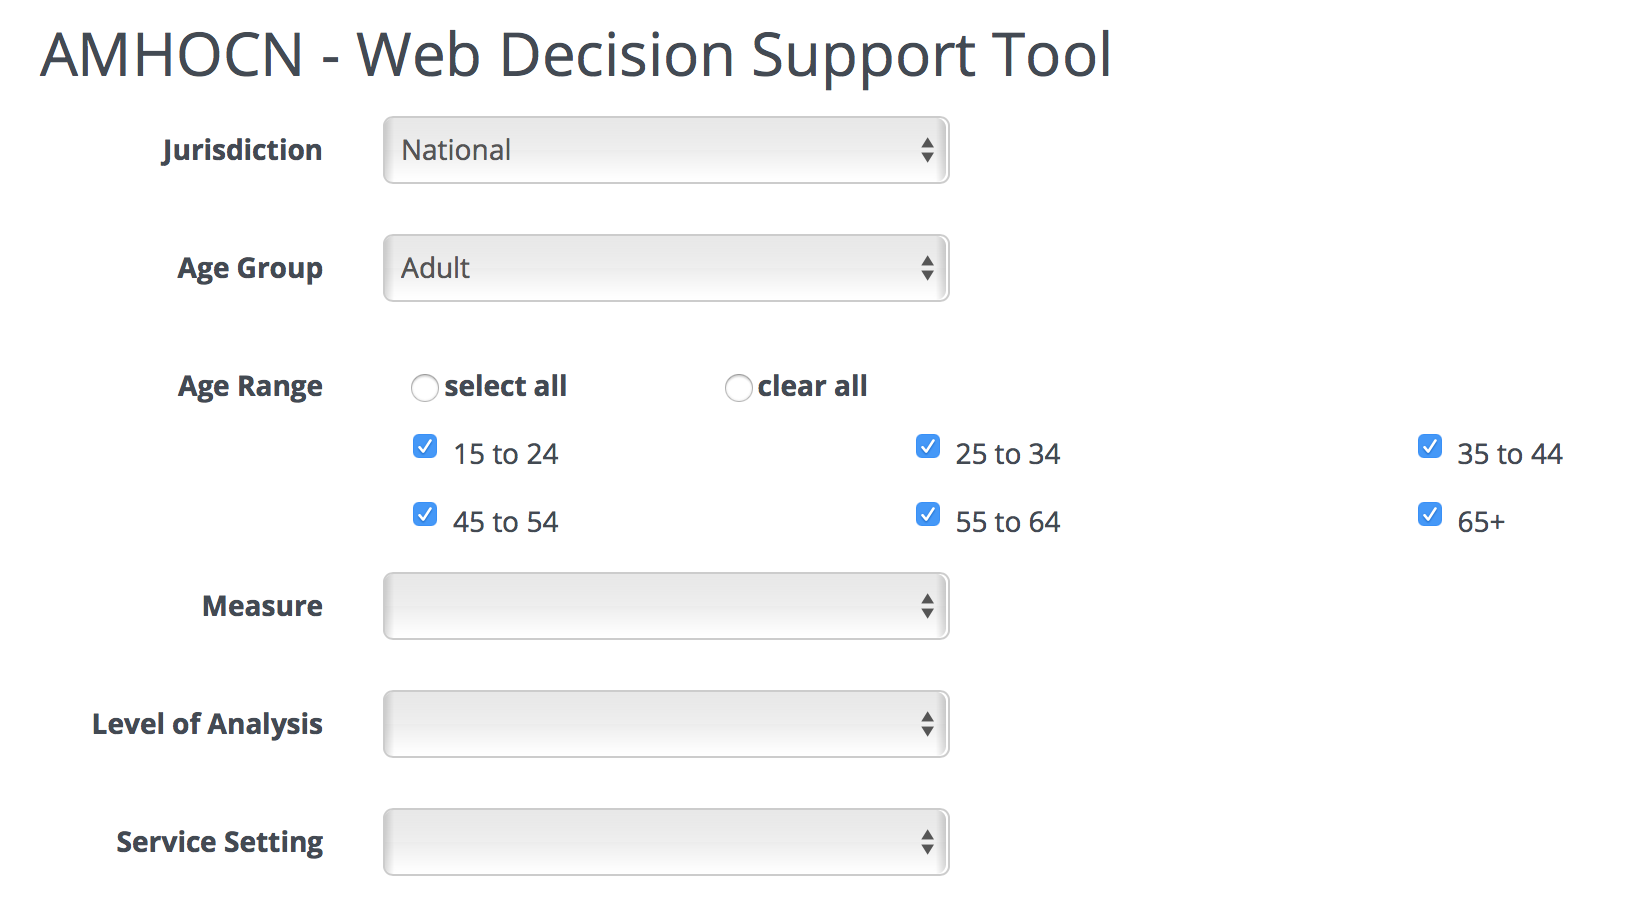
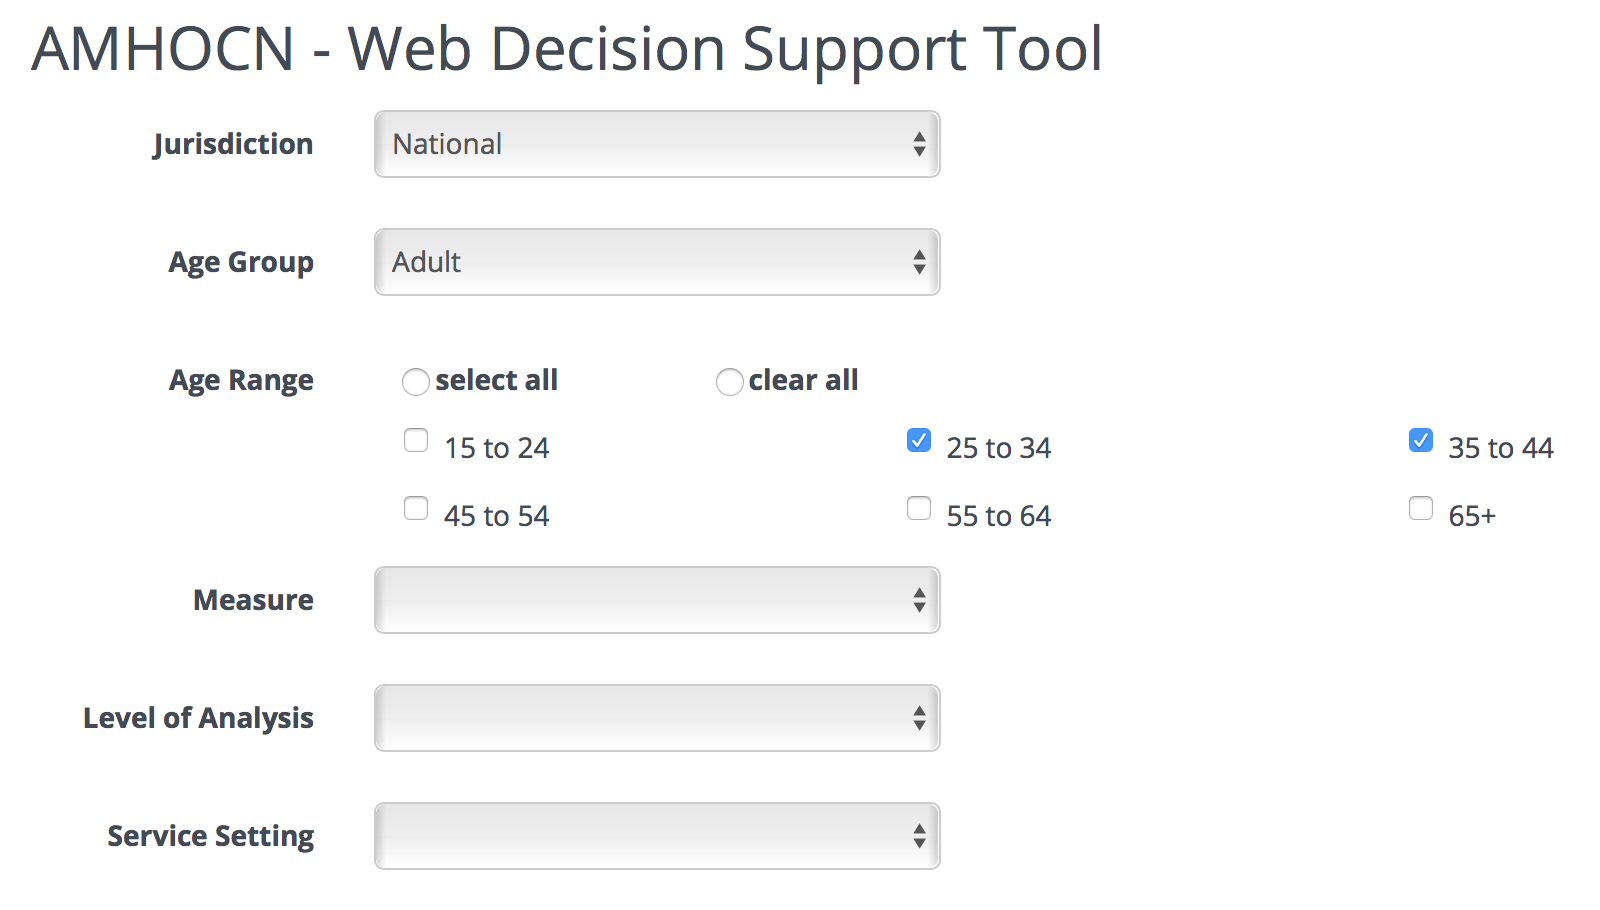
By default, all ages for the specified age group will be included in the age range option, however it is possible to further reduce those who will be included in the analysis. To do so, unselect the age ranges that you do not wish to be included in your search. ‘Select All’ and ‘Clear All’ radio buttons have between provided to assist in your selection.
In the example below, all age ranges except 25-34 and 35-44 have been excluded.
Making a selection from the Age Group option will also bring up a Measure drop down menu from which it is possible to select from a list of outcome measures for that Age Group. These options are:
| Age Group | Outcome Measures |
|---|---|
| Child and Adolescent | HoNOSCA, CGAS, FIHS, SDQ-PC, SDQ-PY and SDQ-YR |
| Adult | HoNOS, LSP-16, Basis-32, K10+L3D, K10+LM and MHI-38 |
| Older Person | HoNOS65+, LSP-16, Basis-32, K10+L3D, K10+LM, MHI-38 and RUG-ADL |
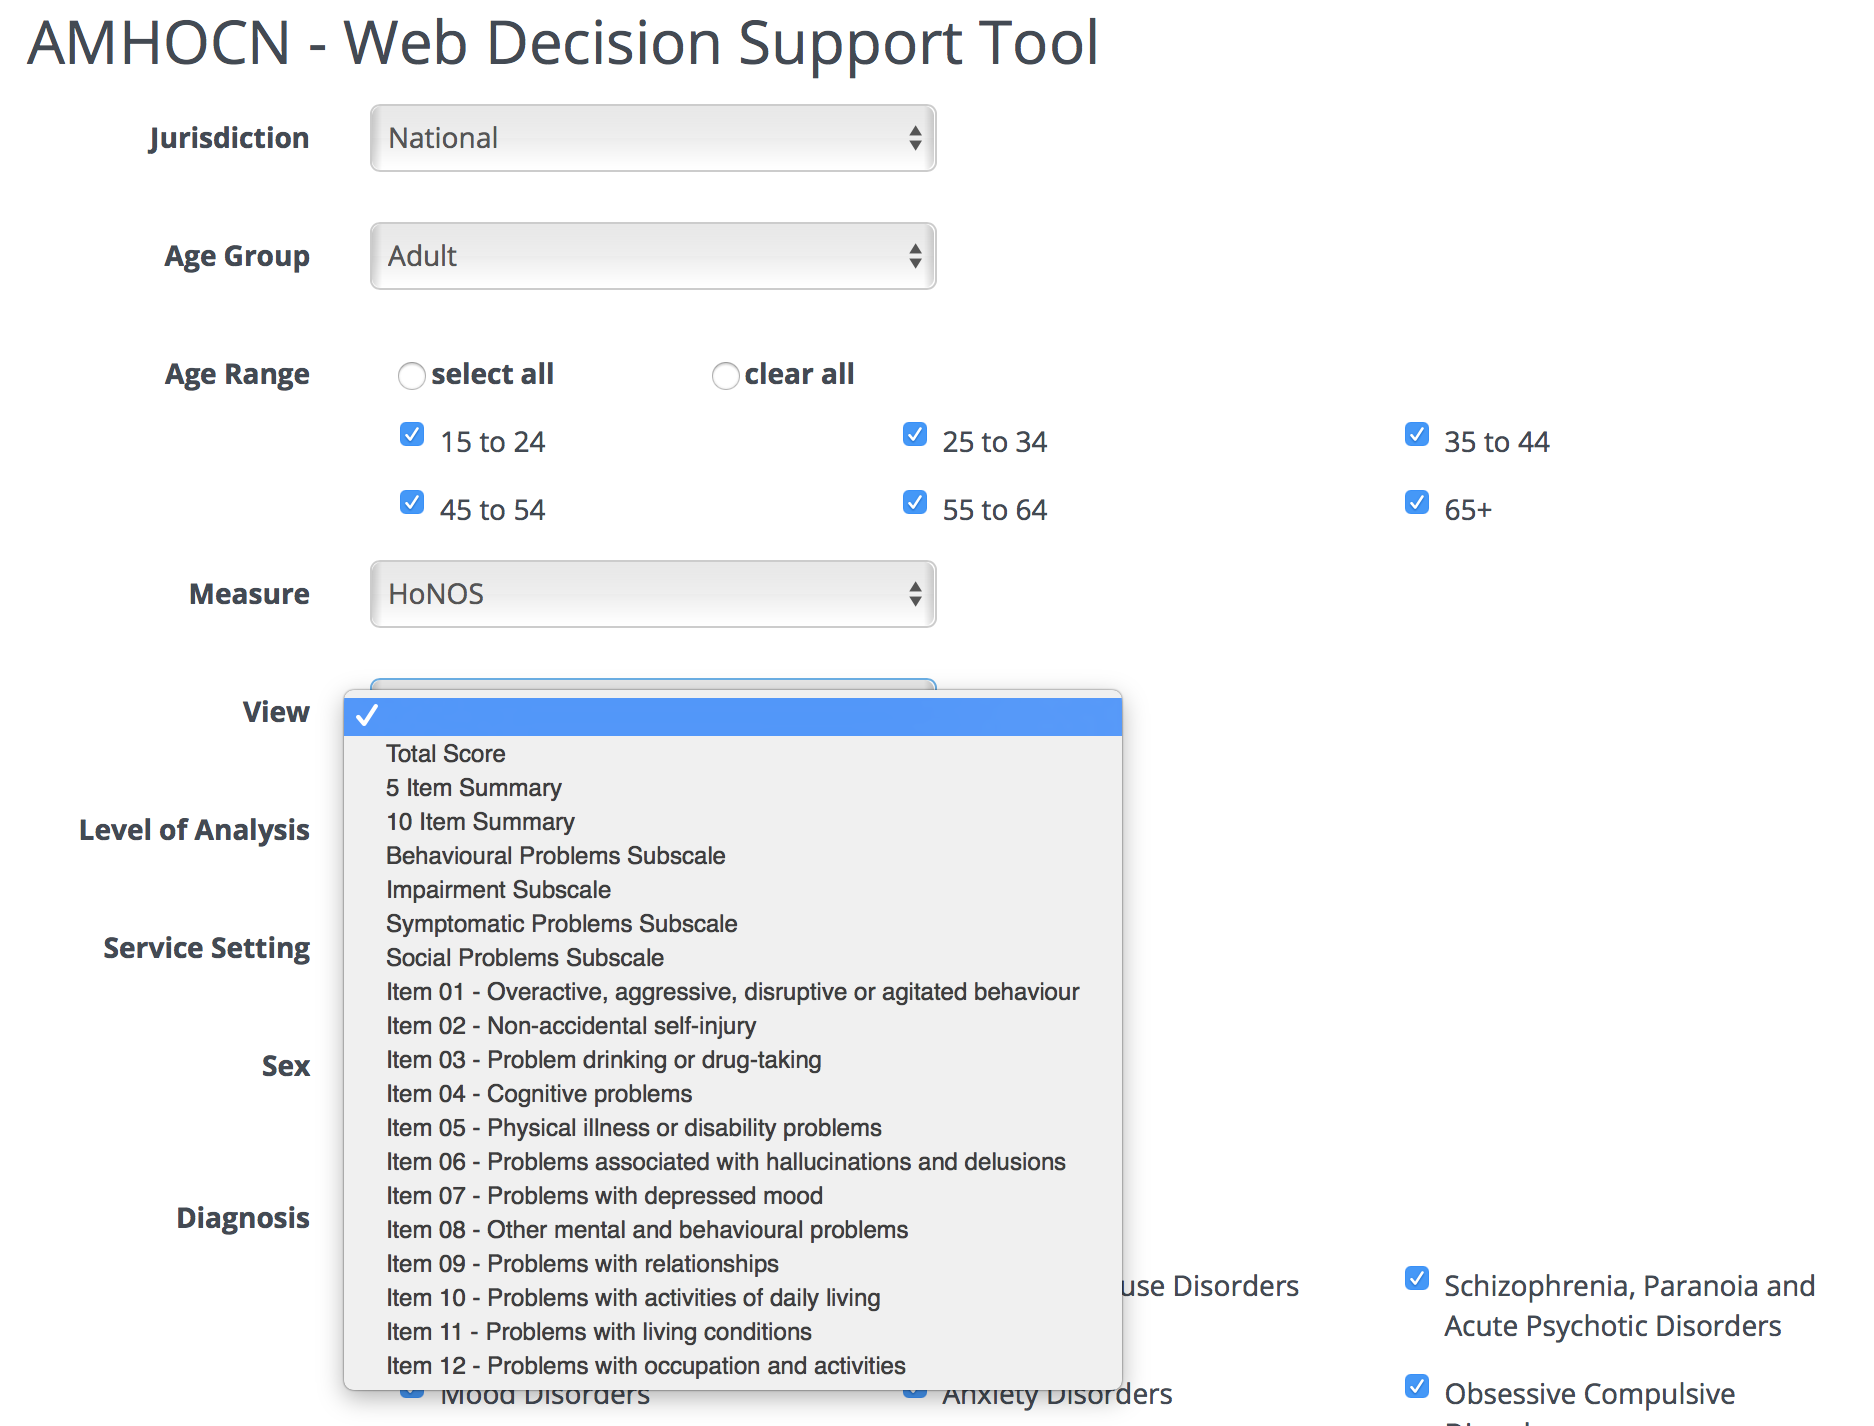
After a measure is selected, another new drop down box - View - appears and a selection must be made. Note that Measure and View are also partitions, hence a selection is mandatory.
Level of Analysis
The next partition is Level of Analysis. Selecting a Level of Analysis of ‘Collection Occasion’ brings up new boxes for Occasion and Individual Comparison Status Score. Occasion is a required field in this context, and you must choose from:
- Admission
- Review
- Discharge
Individual Comparison Status Score is an optional field used to highlight a particular score in the distribution. Typically this is to see where an individual’s score falls compared to the rest of the population. Choosing Episode Transition as the level of analysis brings up a Transition box rather than an Occasion one. The options in this case are:
- Admission/Review
- Admission/Discharge
- Review/Review
- Review/Discharge
The optional Individual Comparison Status Score is also available for a transition. The example below uses collection occasion (admission) as the level of analysis. It also uses the optional individual comparison; the report will now highlight the HoNOS score 16.
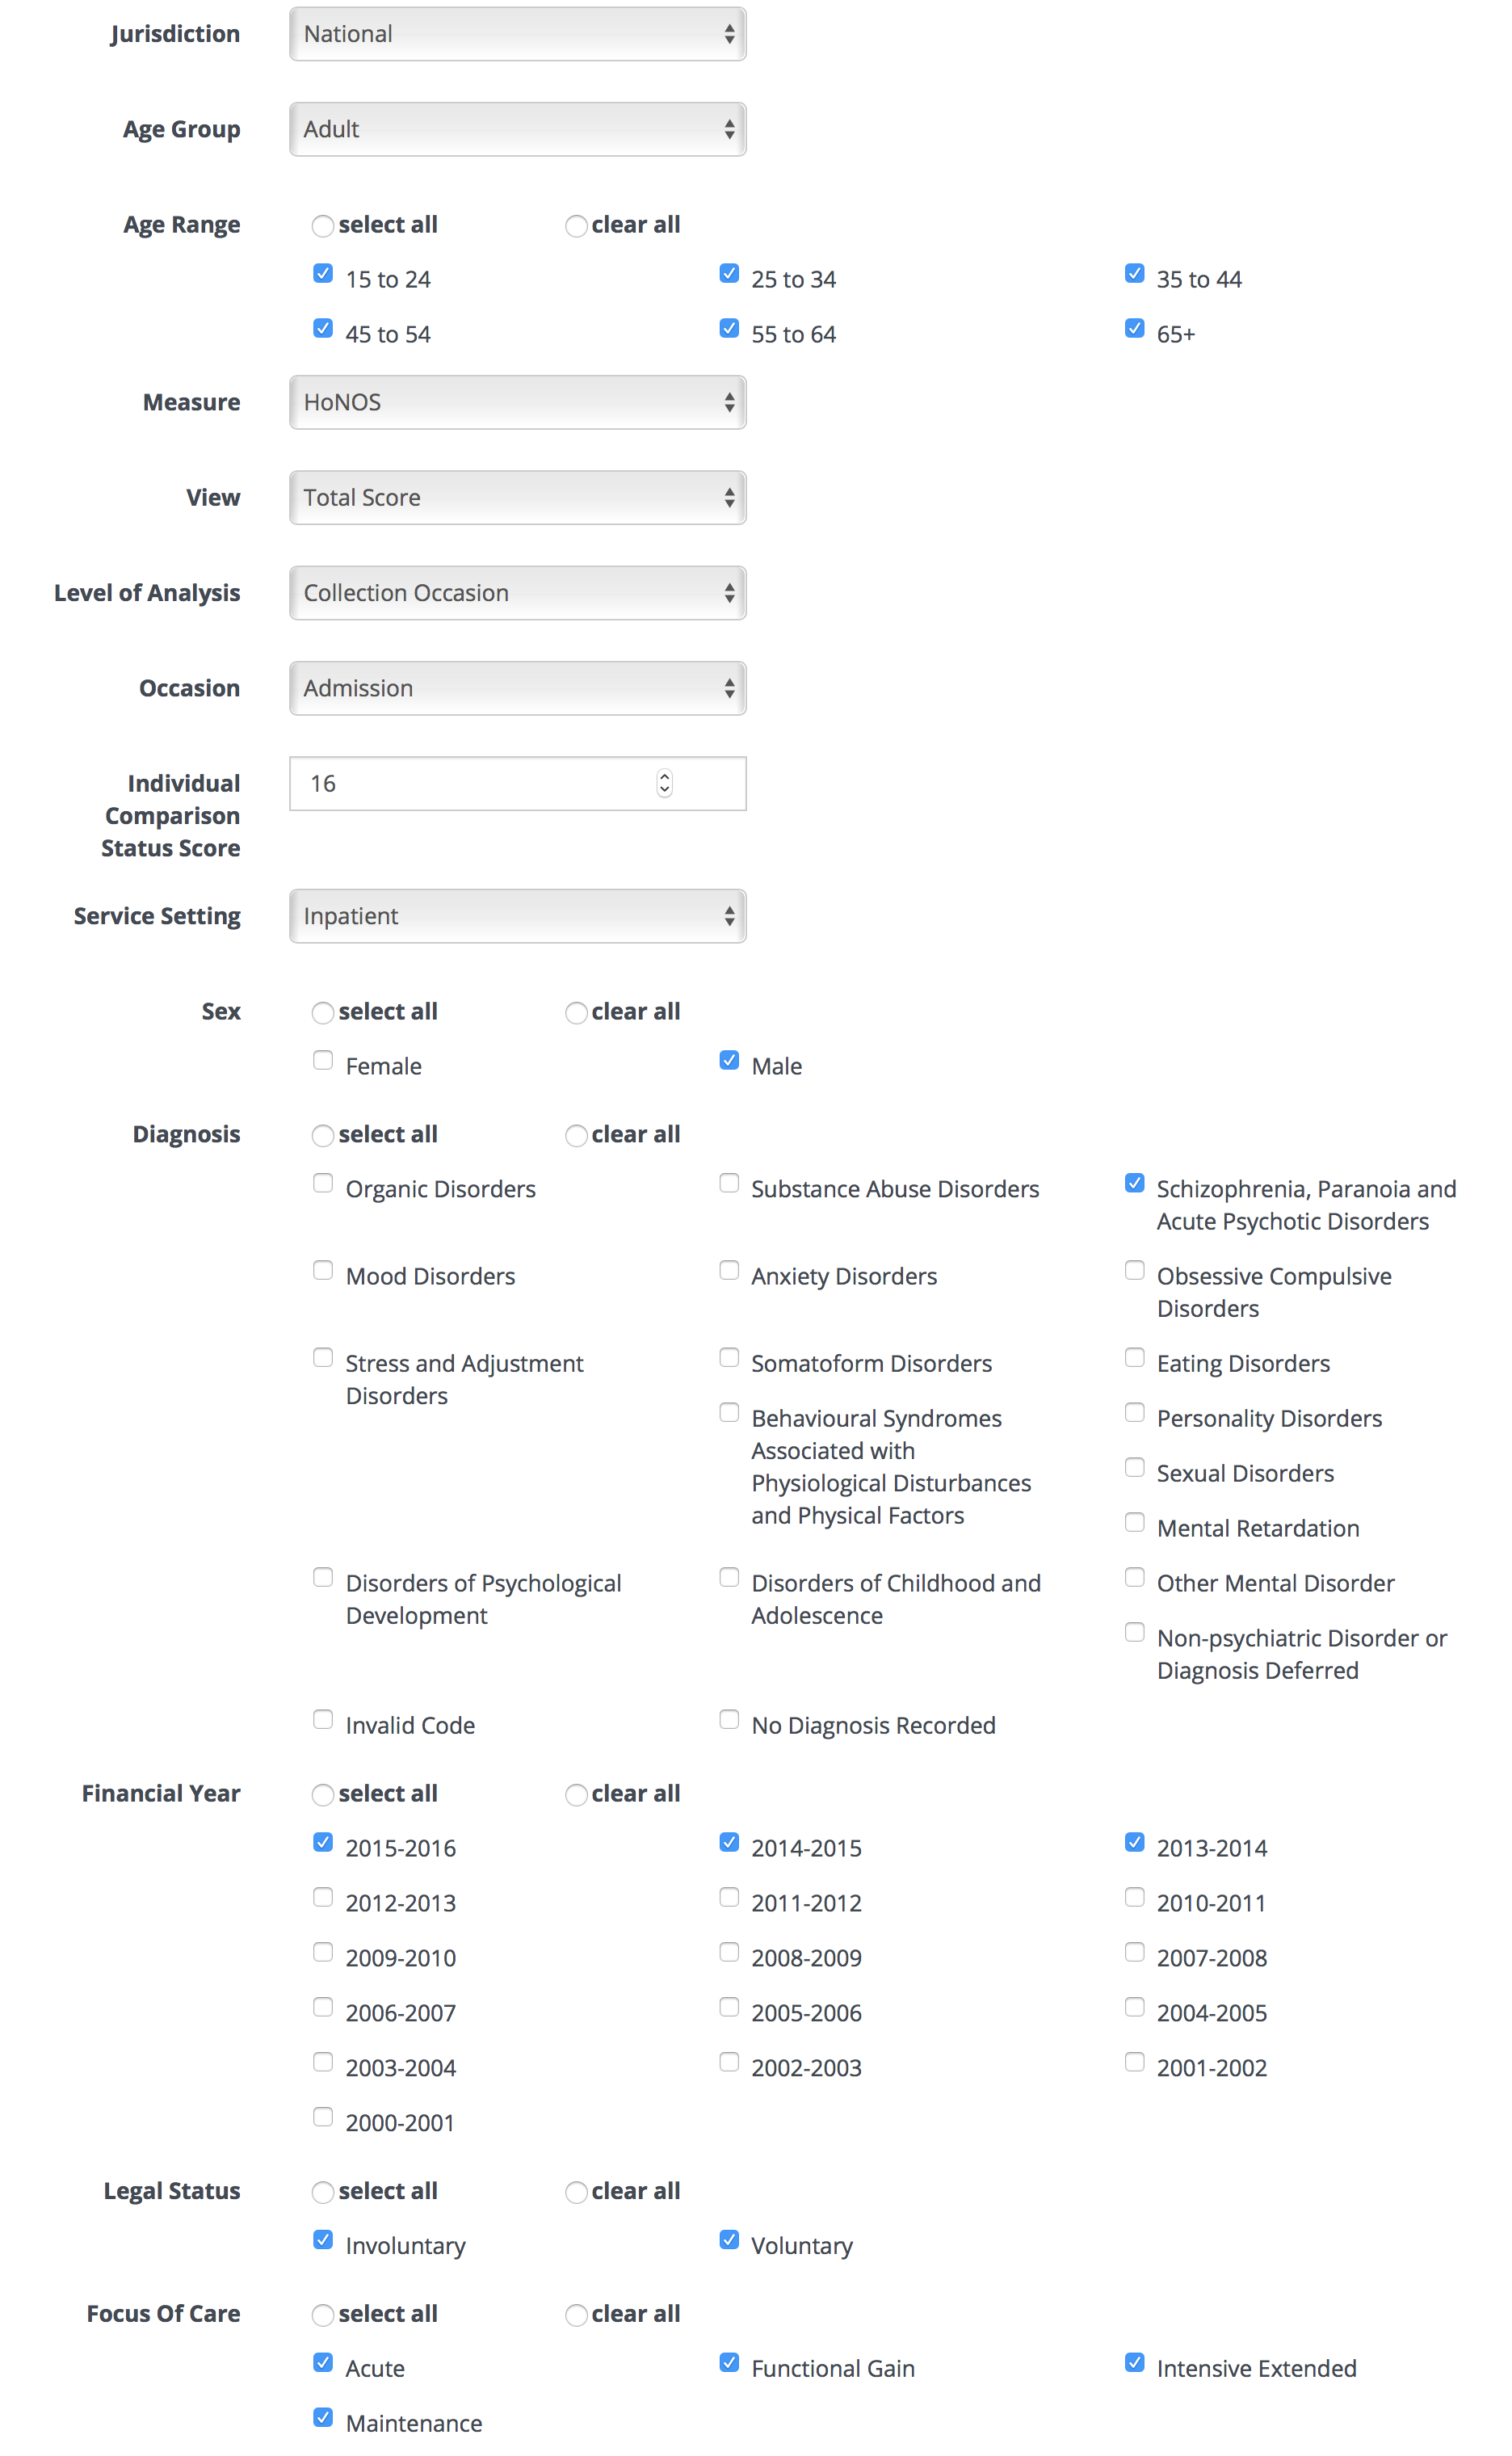
Service Setting
The final partition is Service Setting. The options in this case are:
- Inpatient
- Residential and,
- Ambulatory
Selecting from Service Setting does not initiate any sub selections. The example in the next section illustrates an Inpatient selection.
Sex, Diagnosis, Financial Year, Legal Status and Focus of Care
These final fields are optional, however they can be restricted using exactly the same mechanism as for Age Range described above. The levels of stratification for diagnosis are based on Summary Diagnosis Groupings that were developed originally for the Mental Health Classification and Service Costs (MH-CASC) Project. The example below shows part of a screen showing selections having been made from Sex and Diagnosis:
Query Submission
Click the “Run Query” button at the bottom of the screen to submit your query. There will likely be a short wait while the results are generated. During this time you will see an indicator -
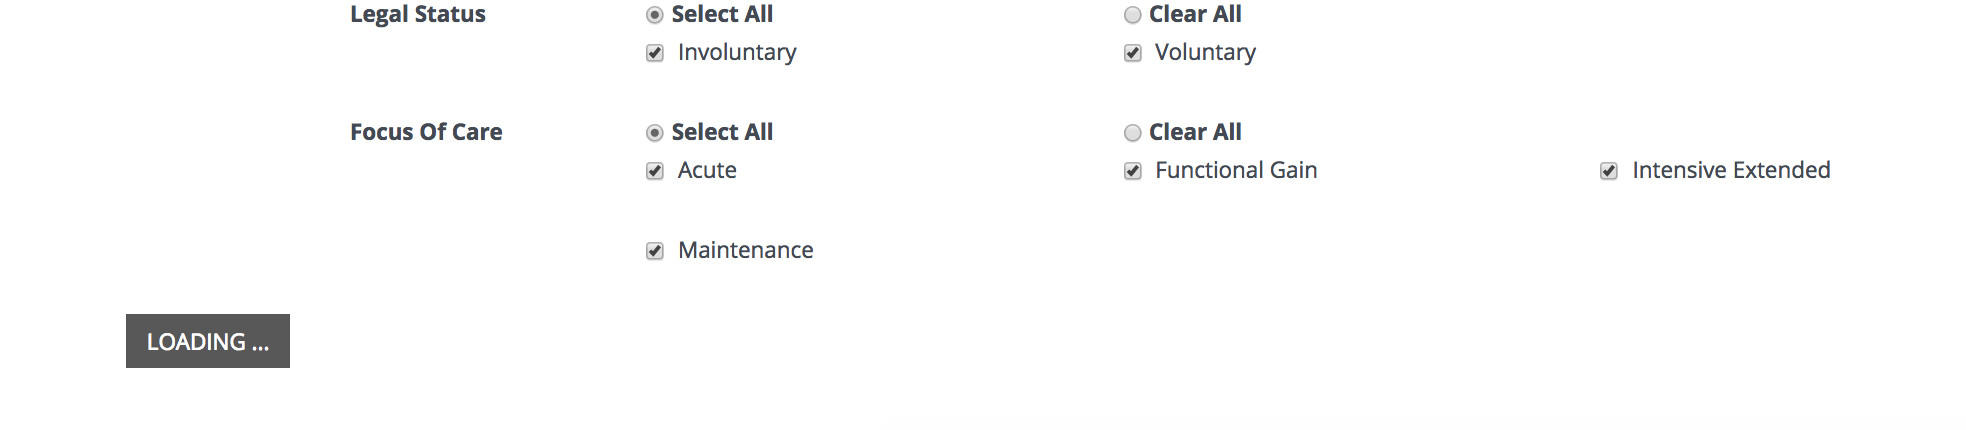
and a message to “Please Wait”. The results of the query will look something like the following:
Sharing and saving queries
Queries can easily be shared between users or saved for later analysis. There are two methods of sharing/saving the results of queries. The first method allows you to save a link which will return you to the query form with all the parameters of your existing query prefilled, the second allows you to download the results of a query so that they can be opened up in a spreadsheet application such as Excel.
1. Share Query link
In the top right of the query is a ‘Share Query’ icon. It looks like this:
Clicking on this link will copy a URL to the clipboard that contains all the parameters of your query. You can now save this URL as a bookmark or copy and paste it in order to share or save it for later analysis.
2. Download the results of the query
In the top right of the query is a ‘Download Query’ icon. It looks like this:
Clicking on this link will download a CSV file. This file can be opened up in a spreadsheet application such as Excel. It contains all the parameters from your query and the statistical results as well as a table containing the data from the chart.
Editing a query
Queries can easily be edited. In the top right of the query is an ‘Edit Query’ icon. It looks like this:
Clicking on this link will return you to the query form. Change the parameters of your query and click ‘Run Query’. Your new results will be generated.
Adding multiple charts
Multiple charts can be added to the page in order to compare queries.
In order to add a second chart click on the ‘Add Query’ button.
You will be returned to the query form. Enter the parameters of your new query and click ‘Run Query’.
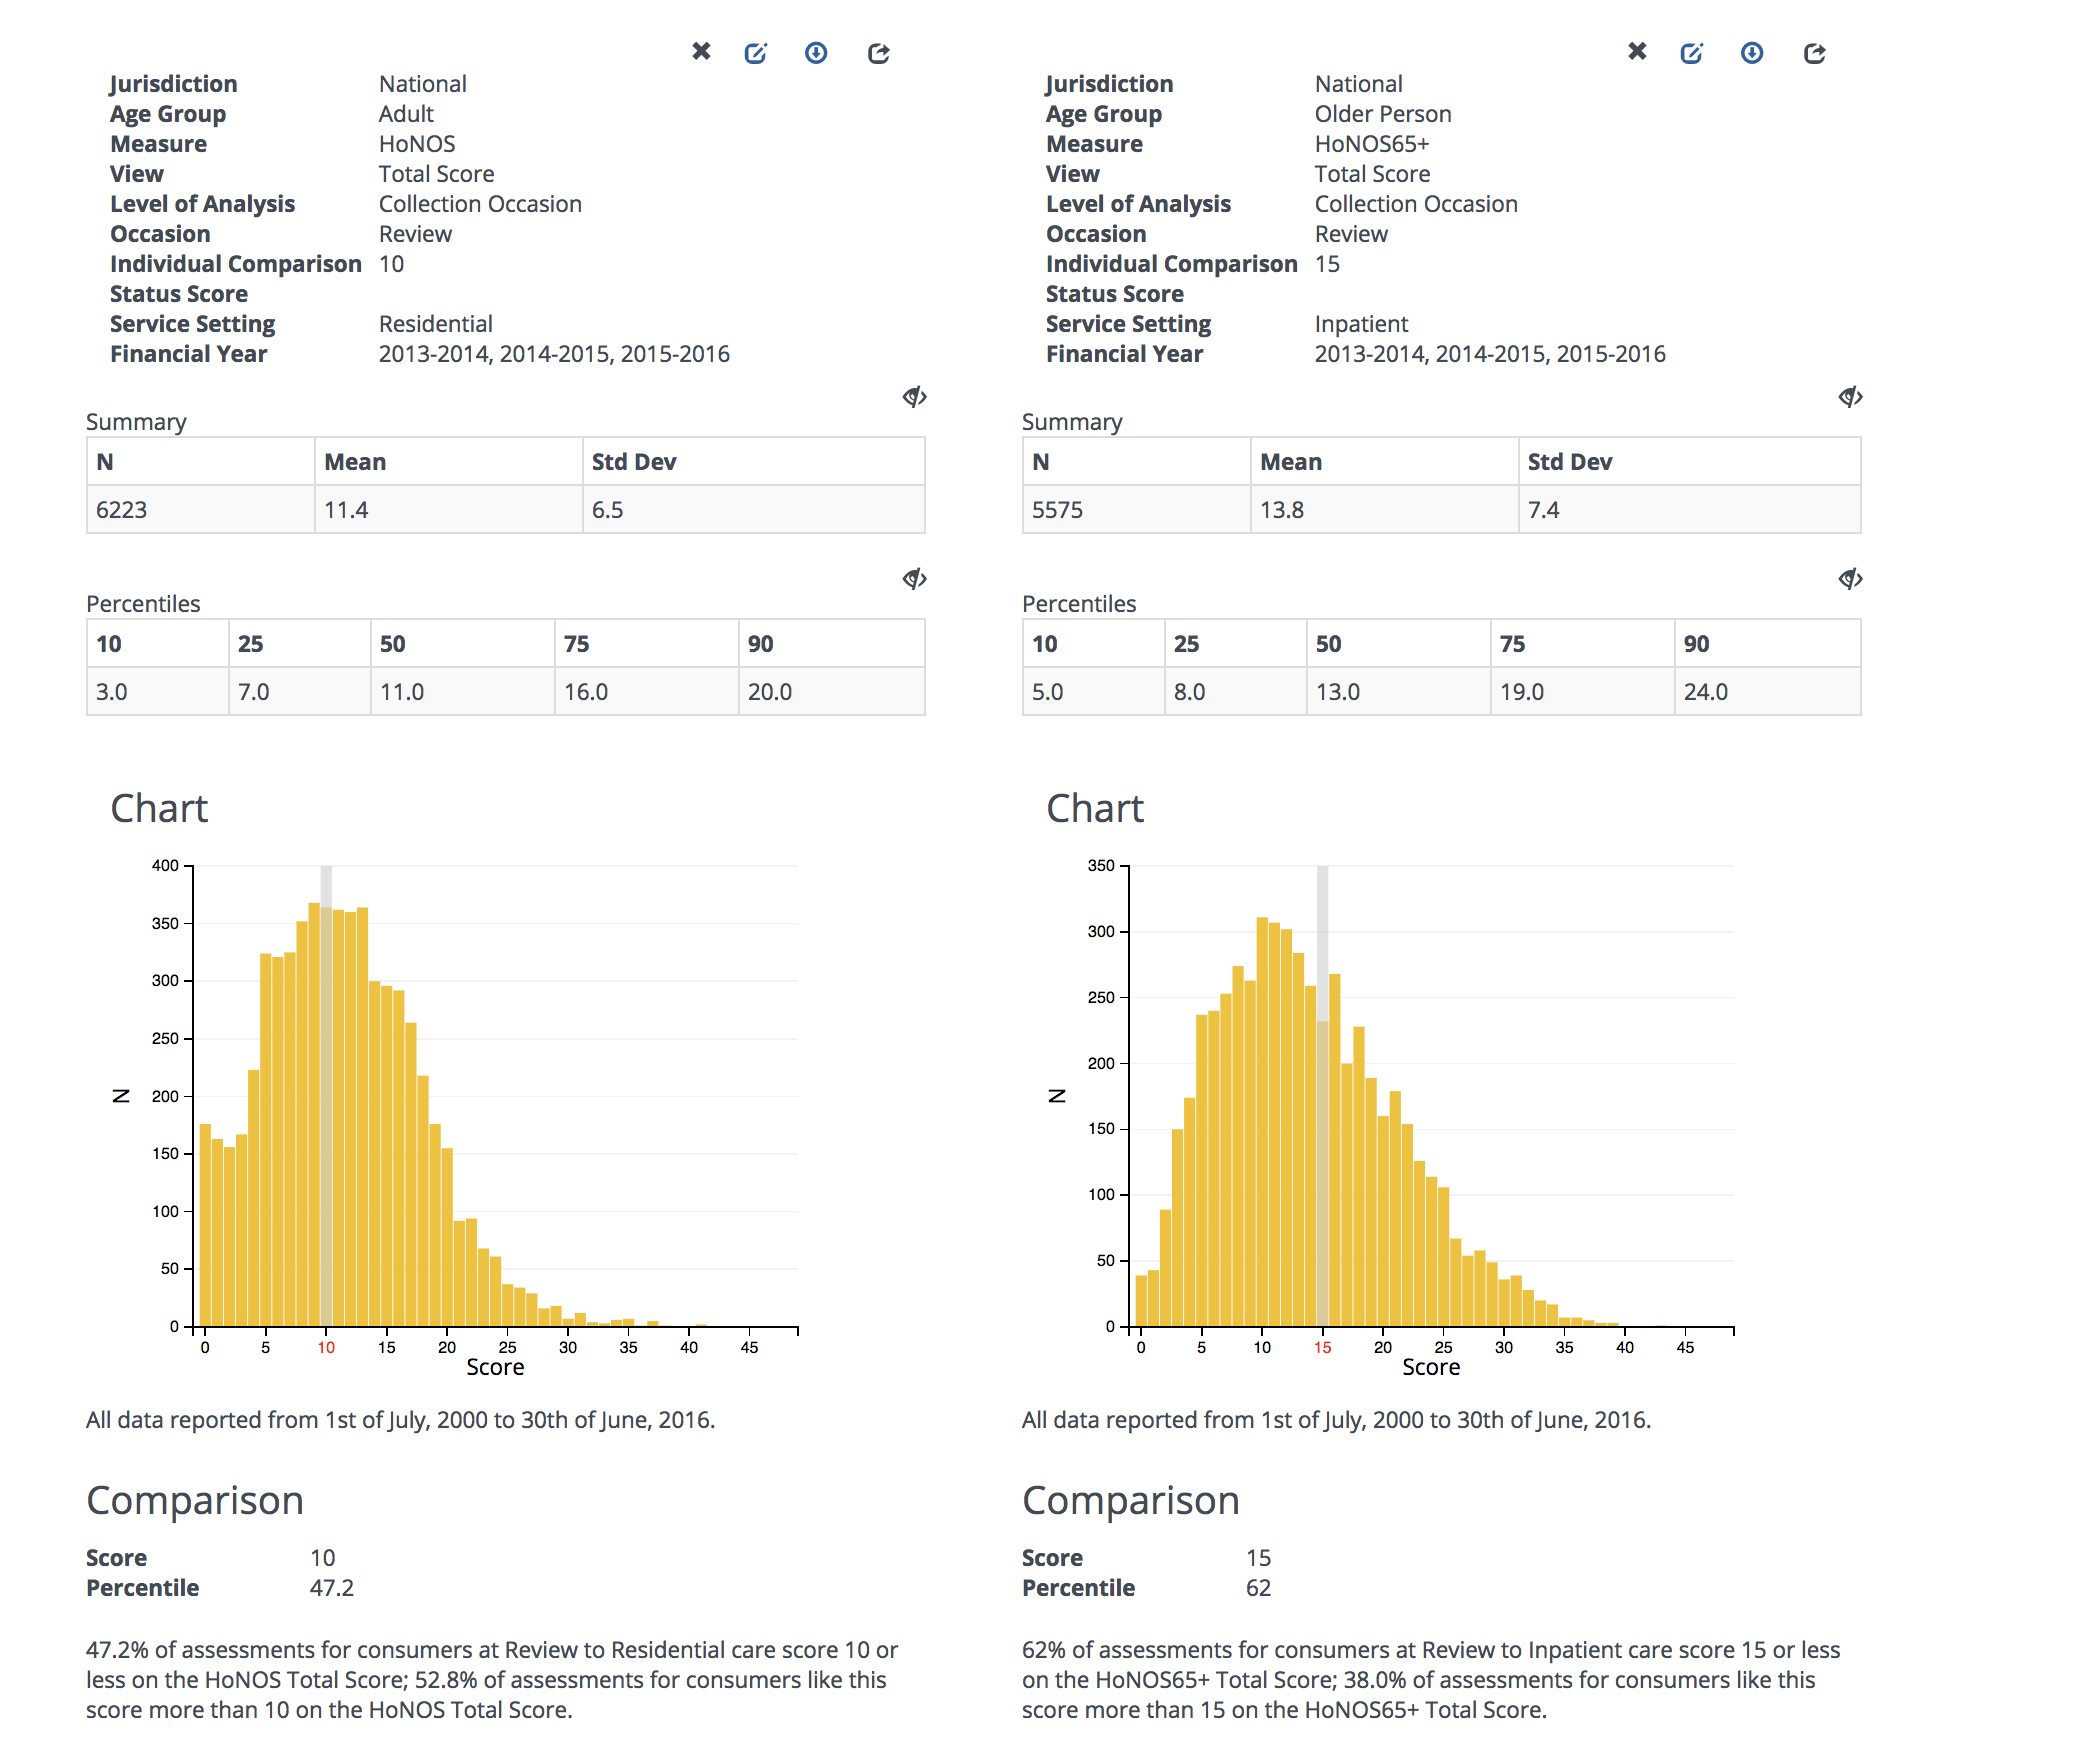
The query results will now show two charts and associated information.
Removing a chart
Charts can easily be removed. In the top right of the query is a ‘Remove Query’ icon. It looks like this:
Clicking this icon will remove the associated chart from the window.
Examples
Two examples are provided below. The first considers an individual consumer’s mental health status at admission to inpatient care. The second considers the change in mental health status during the course of an episode for the same consumer.
Example 1: Mental health status
Imagine you are a clinician working in an adult inpatient unit, and you are interested in comparing one of your consumers, Kim, at admission with the national aggregate. Kim is a female, aged 41 and has a diagnosis of schizophrenia. Using the specification section of the WDST, you select the following:
| Jurisdiction | National |
| Age Group | Adult |
| Measure | HoNOS |
| View | Total Score (12 items) |
| Age Range | 35-44 |
| Level of Analysis | Collection Occasion Status |
| Collection Occasion | Admission |
| Service Setting | Inpatient |
| Sex | Female |
| Diagnosis | Schizophrenia, Paranoia and Acute Psychotic Disorders |
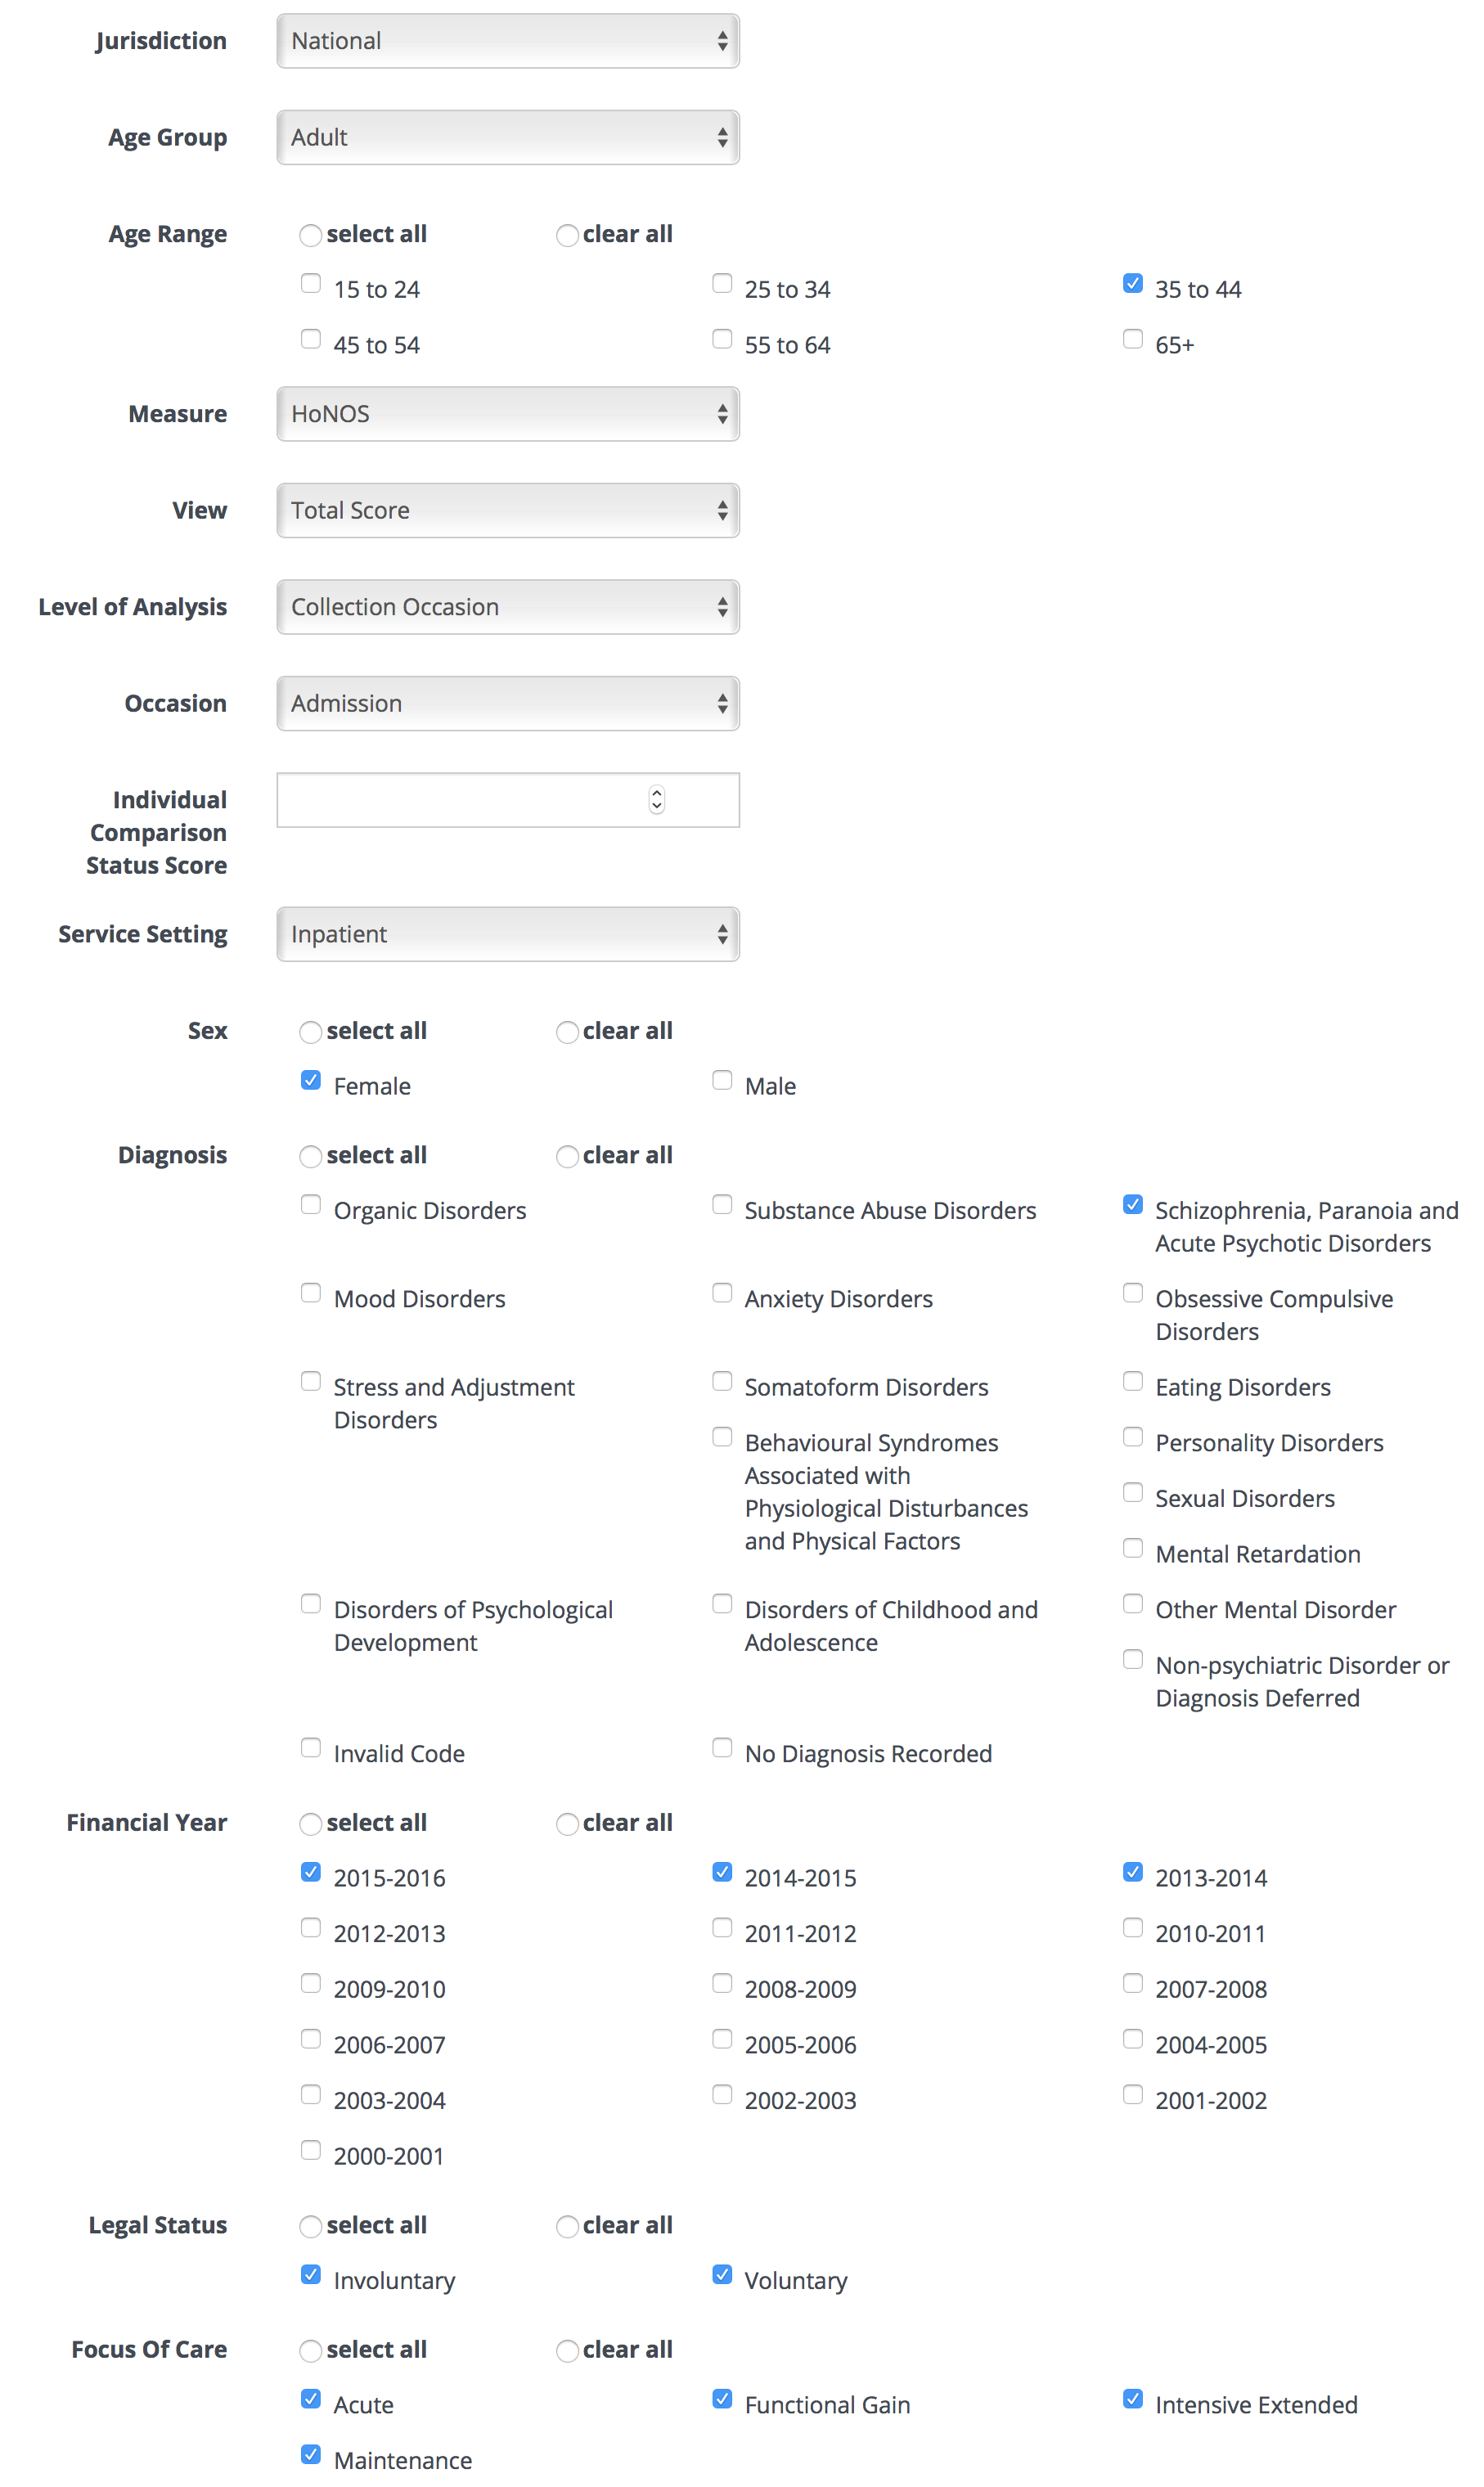
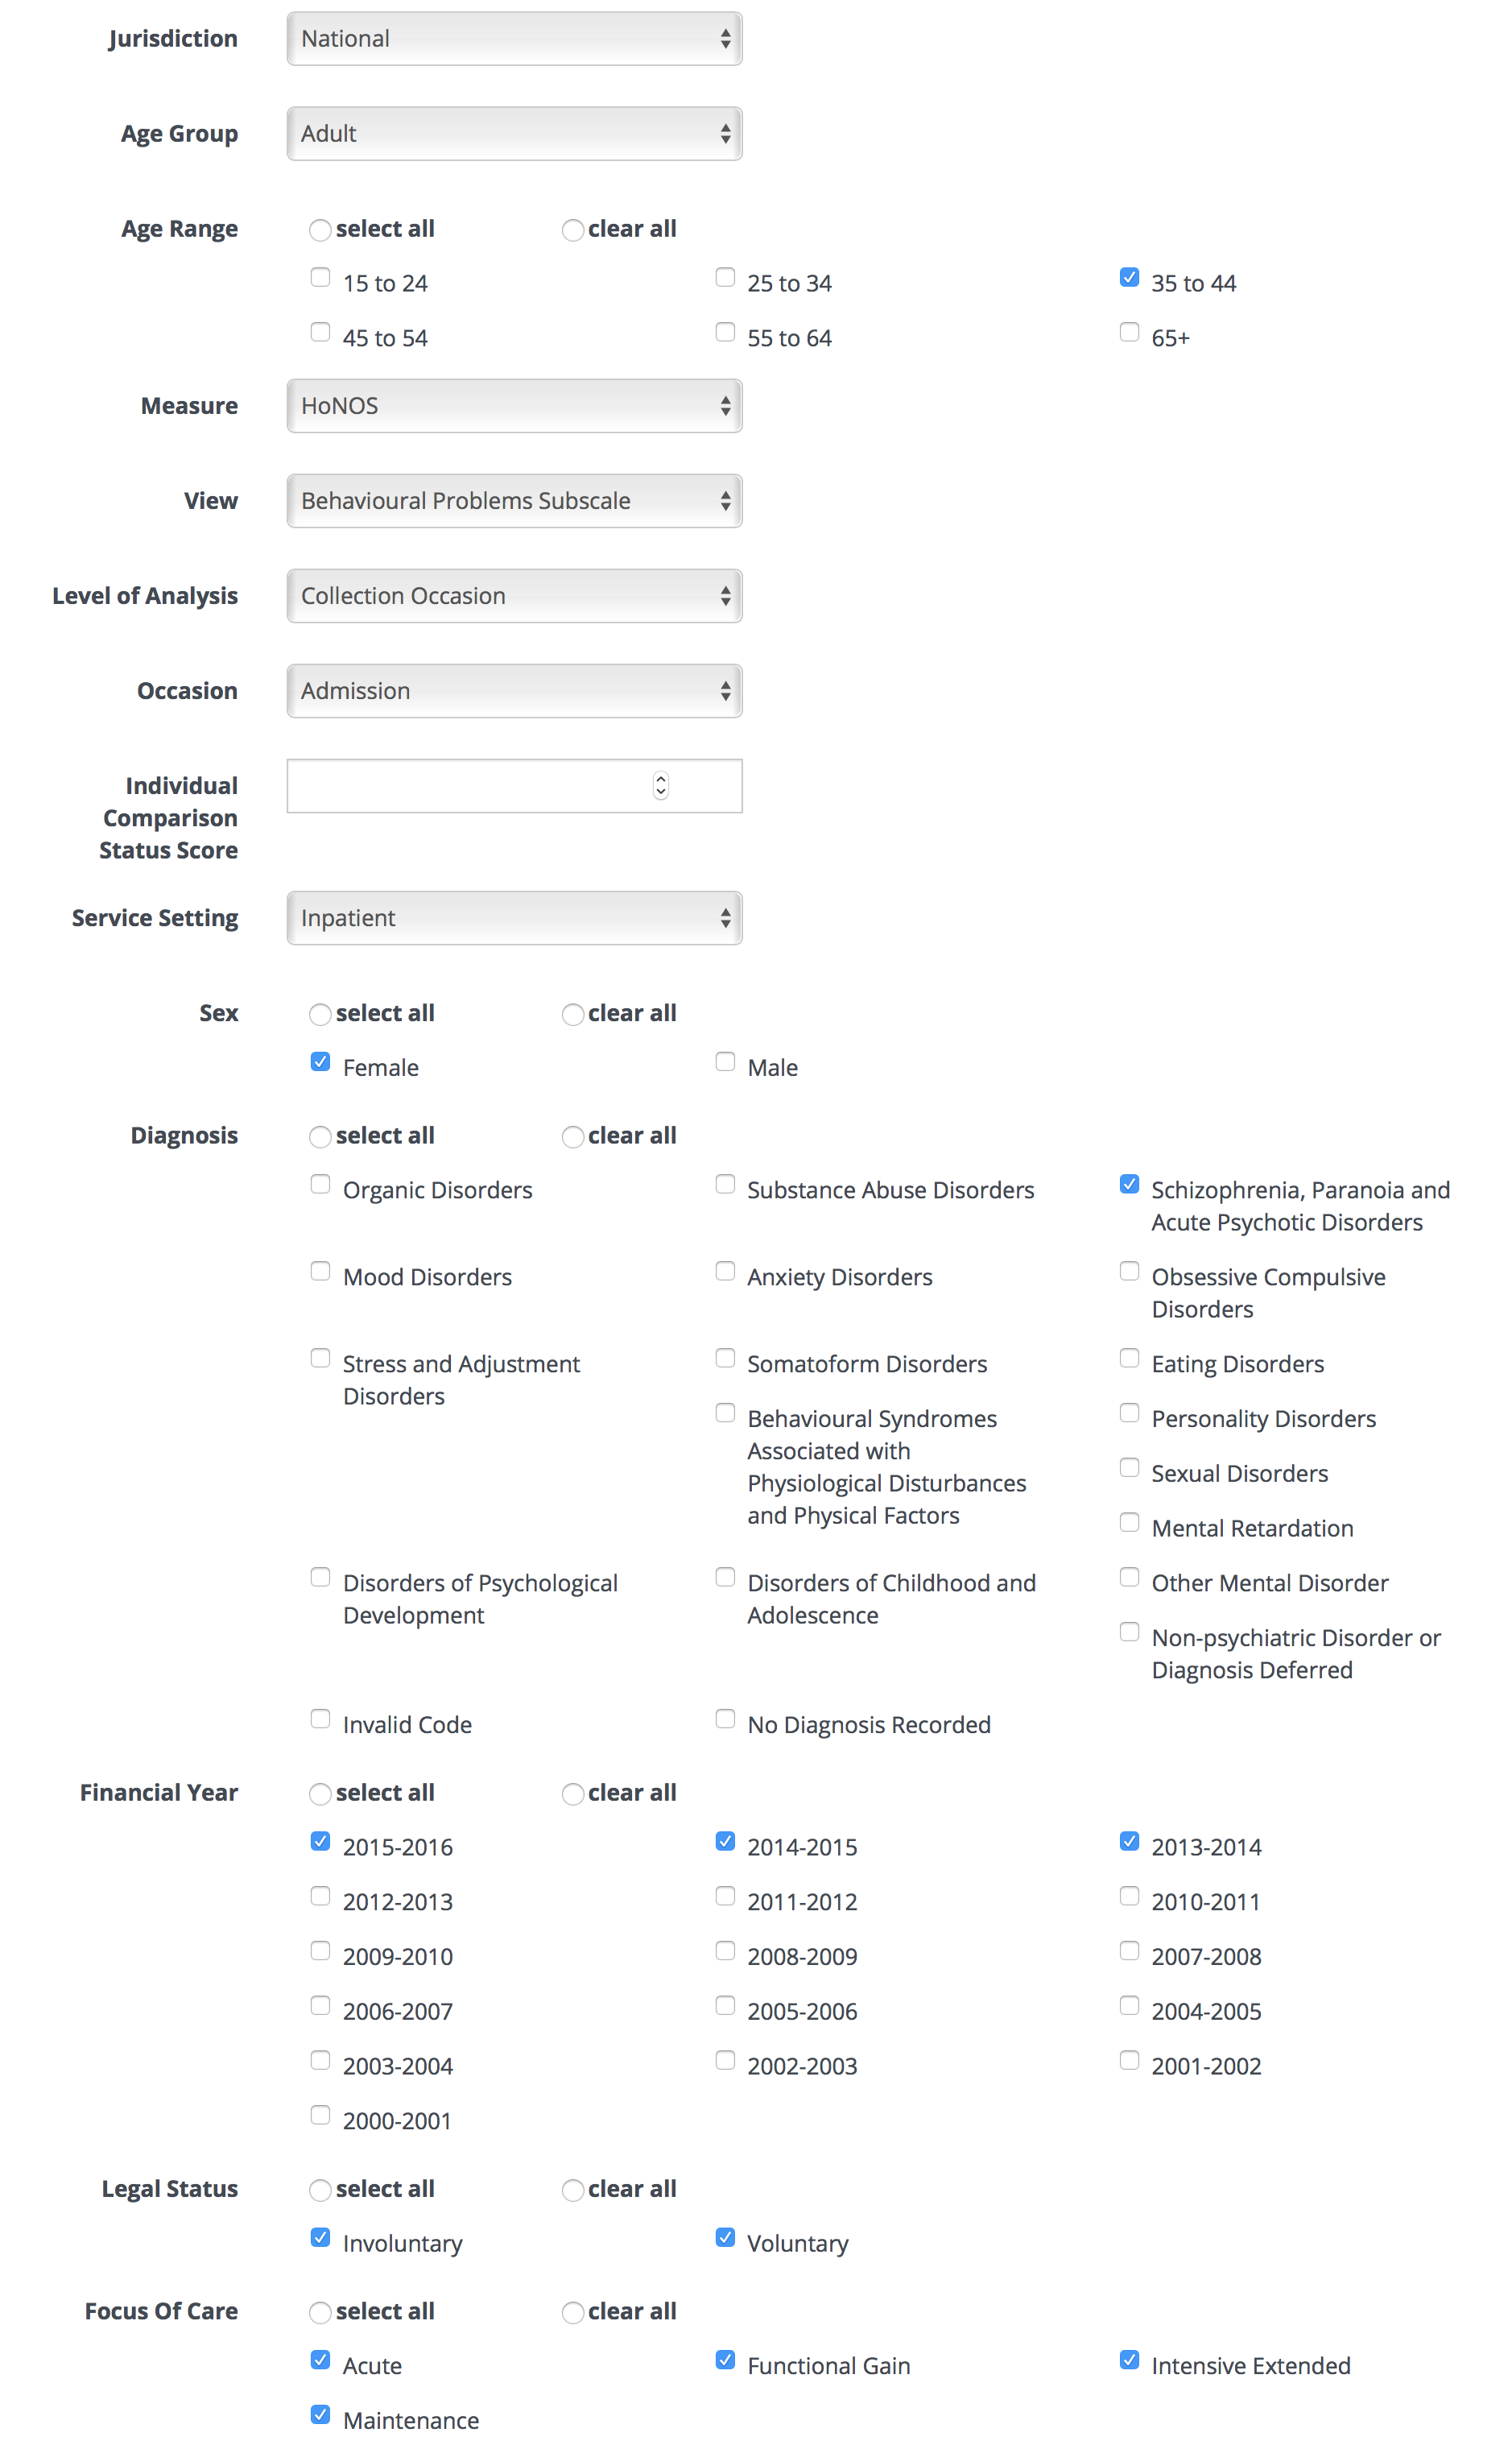
Your selection should look like this:
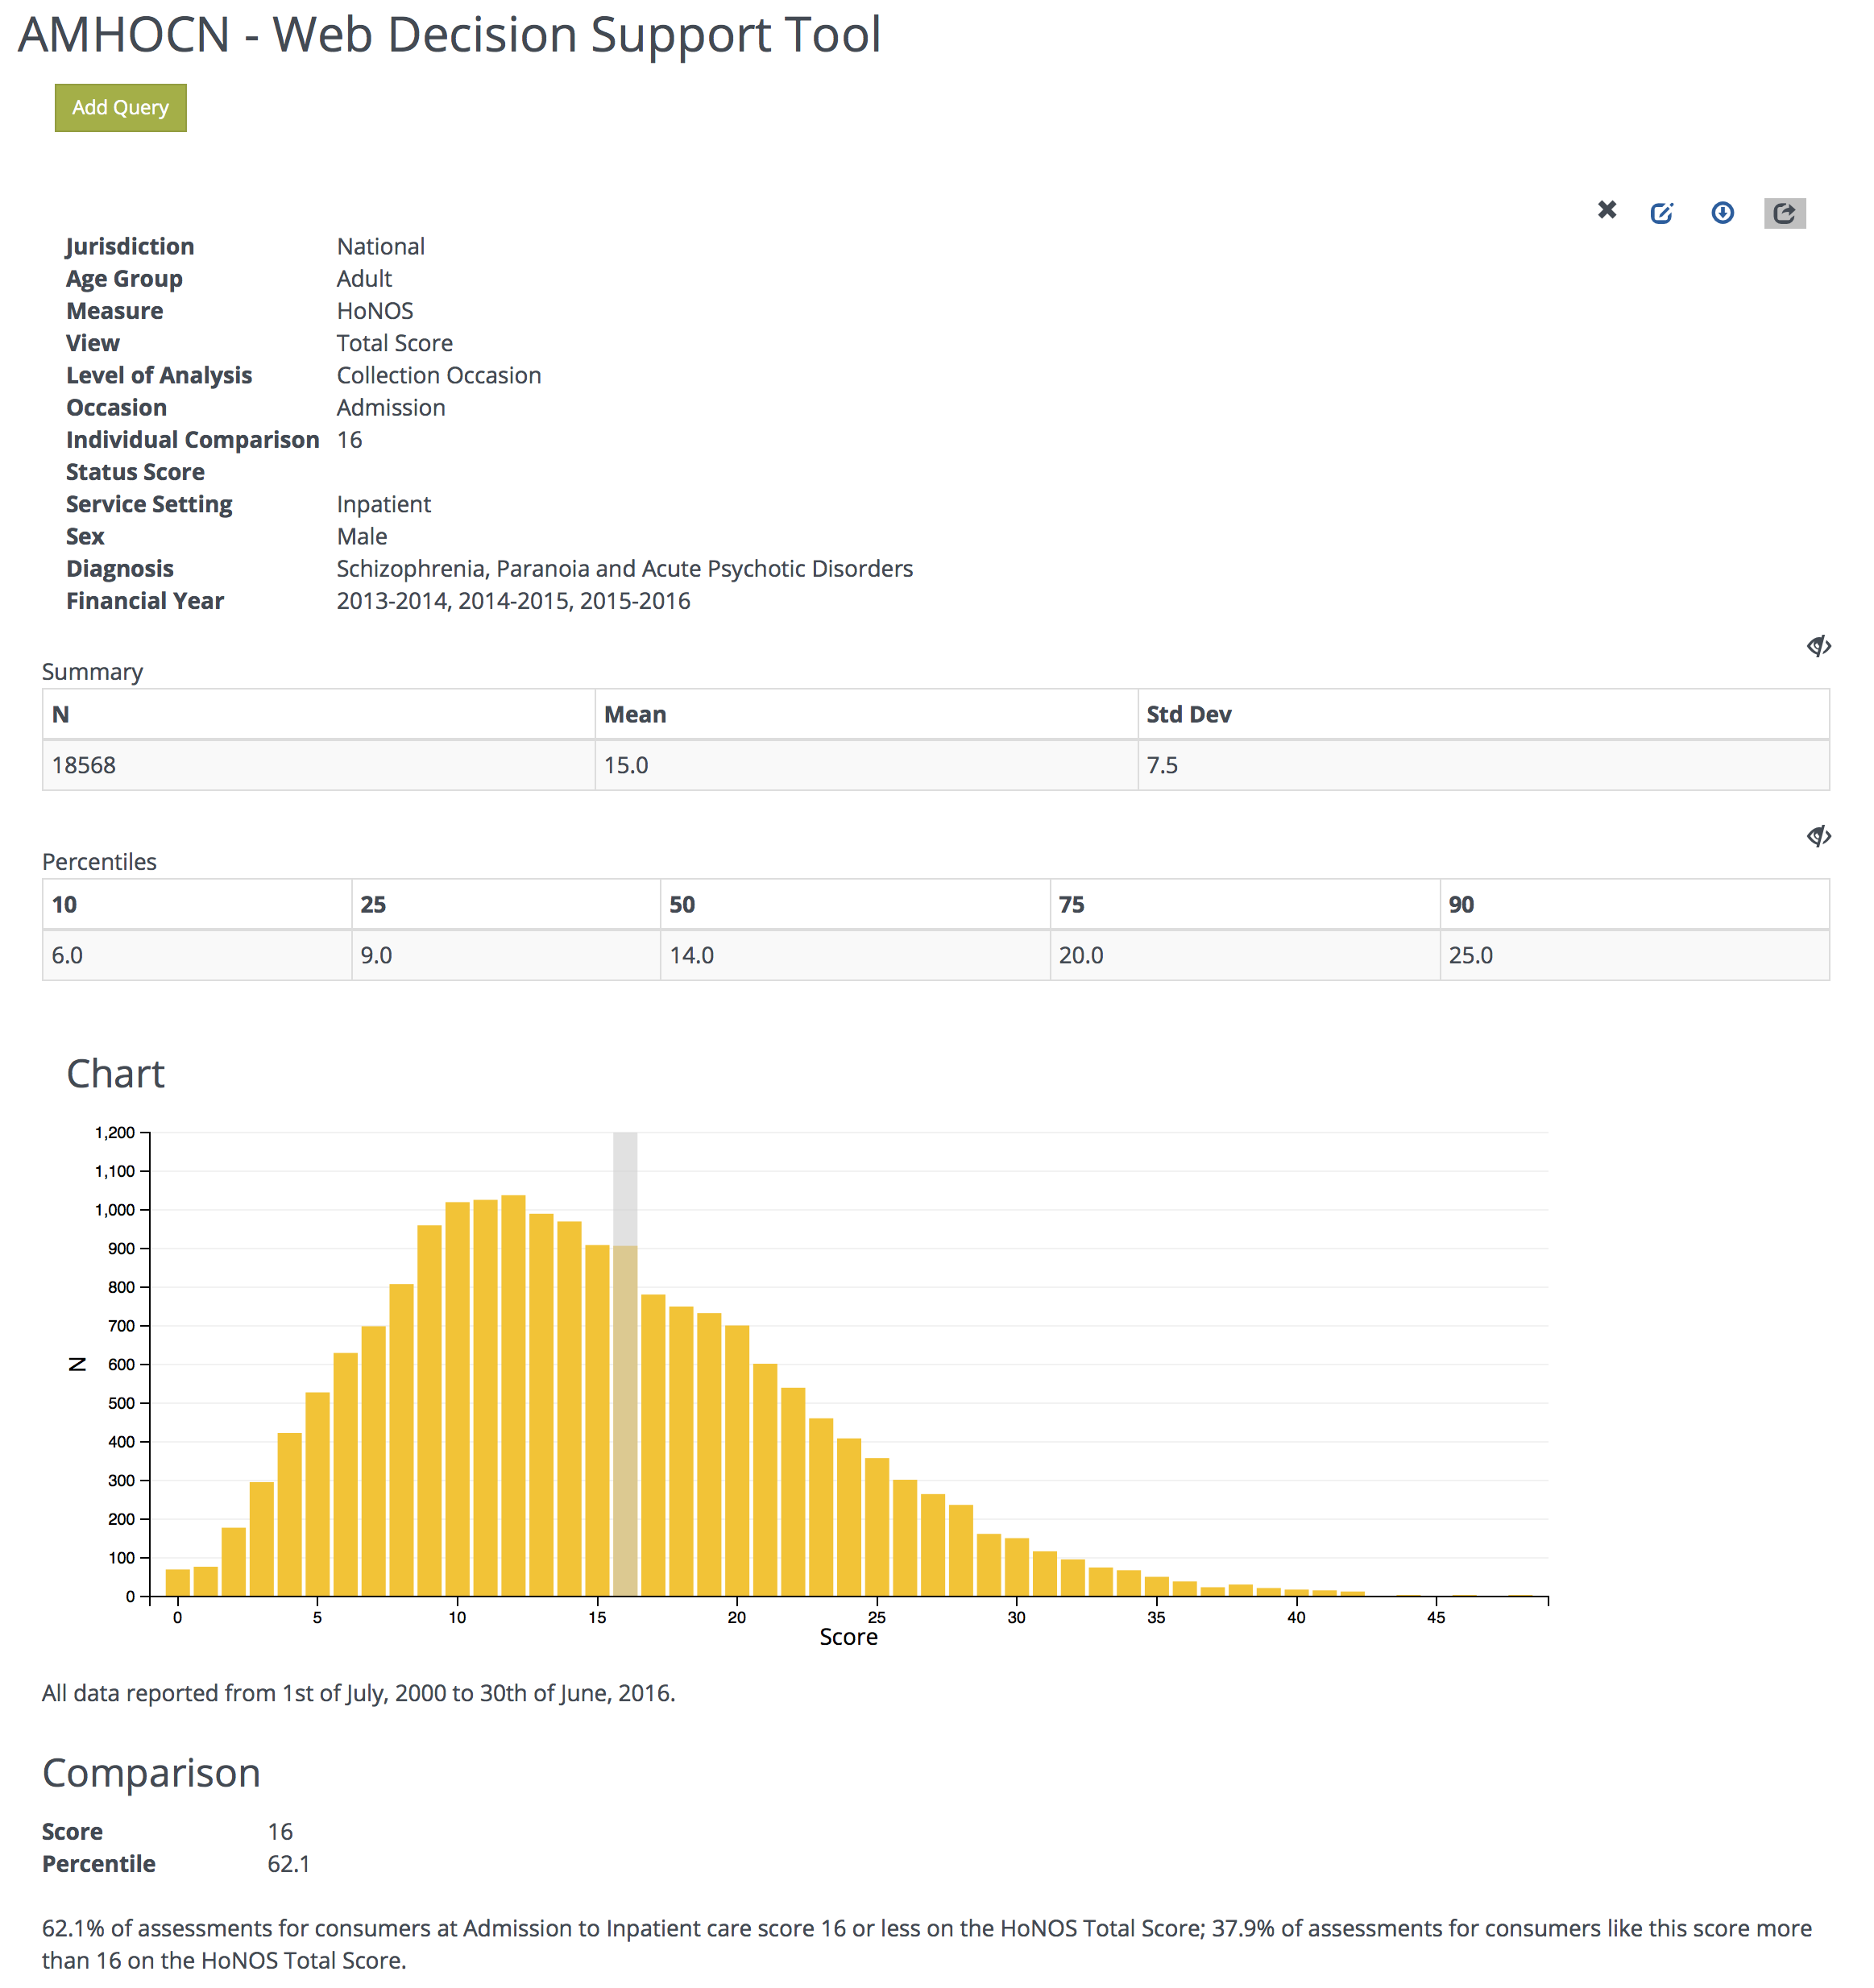
The results:
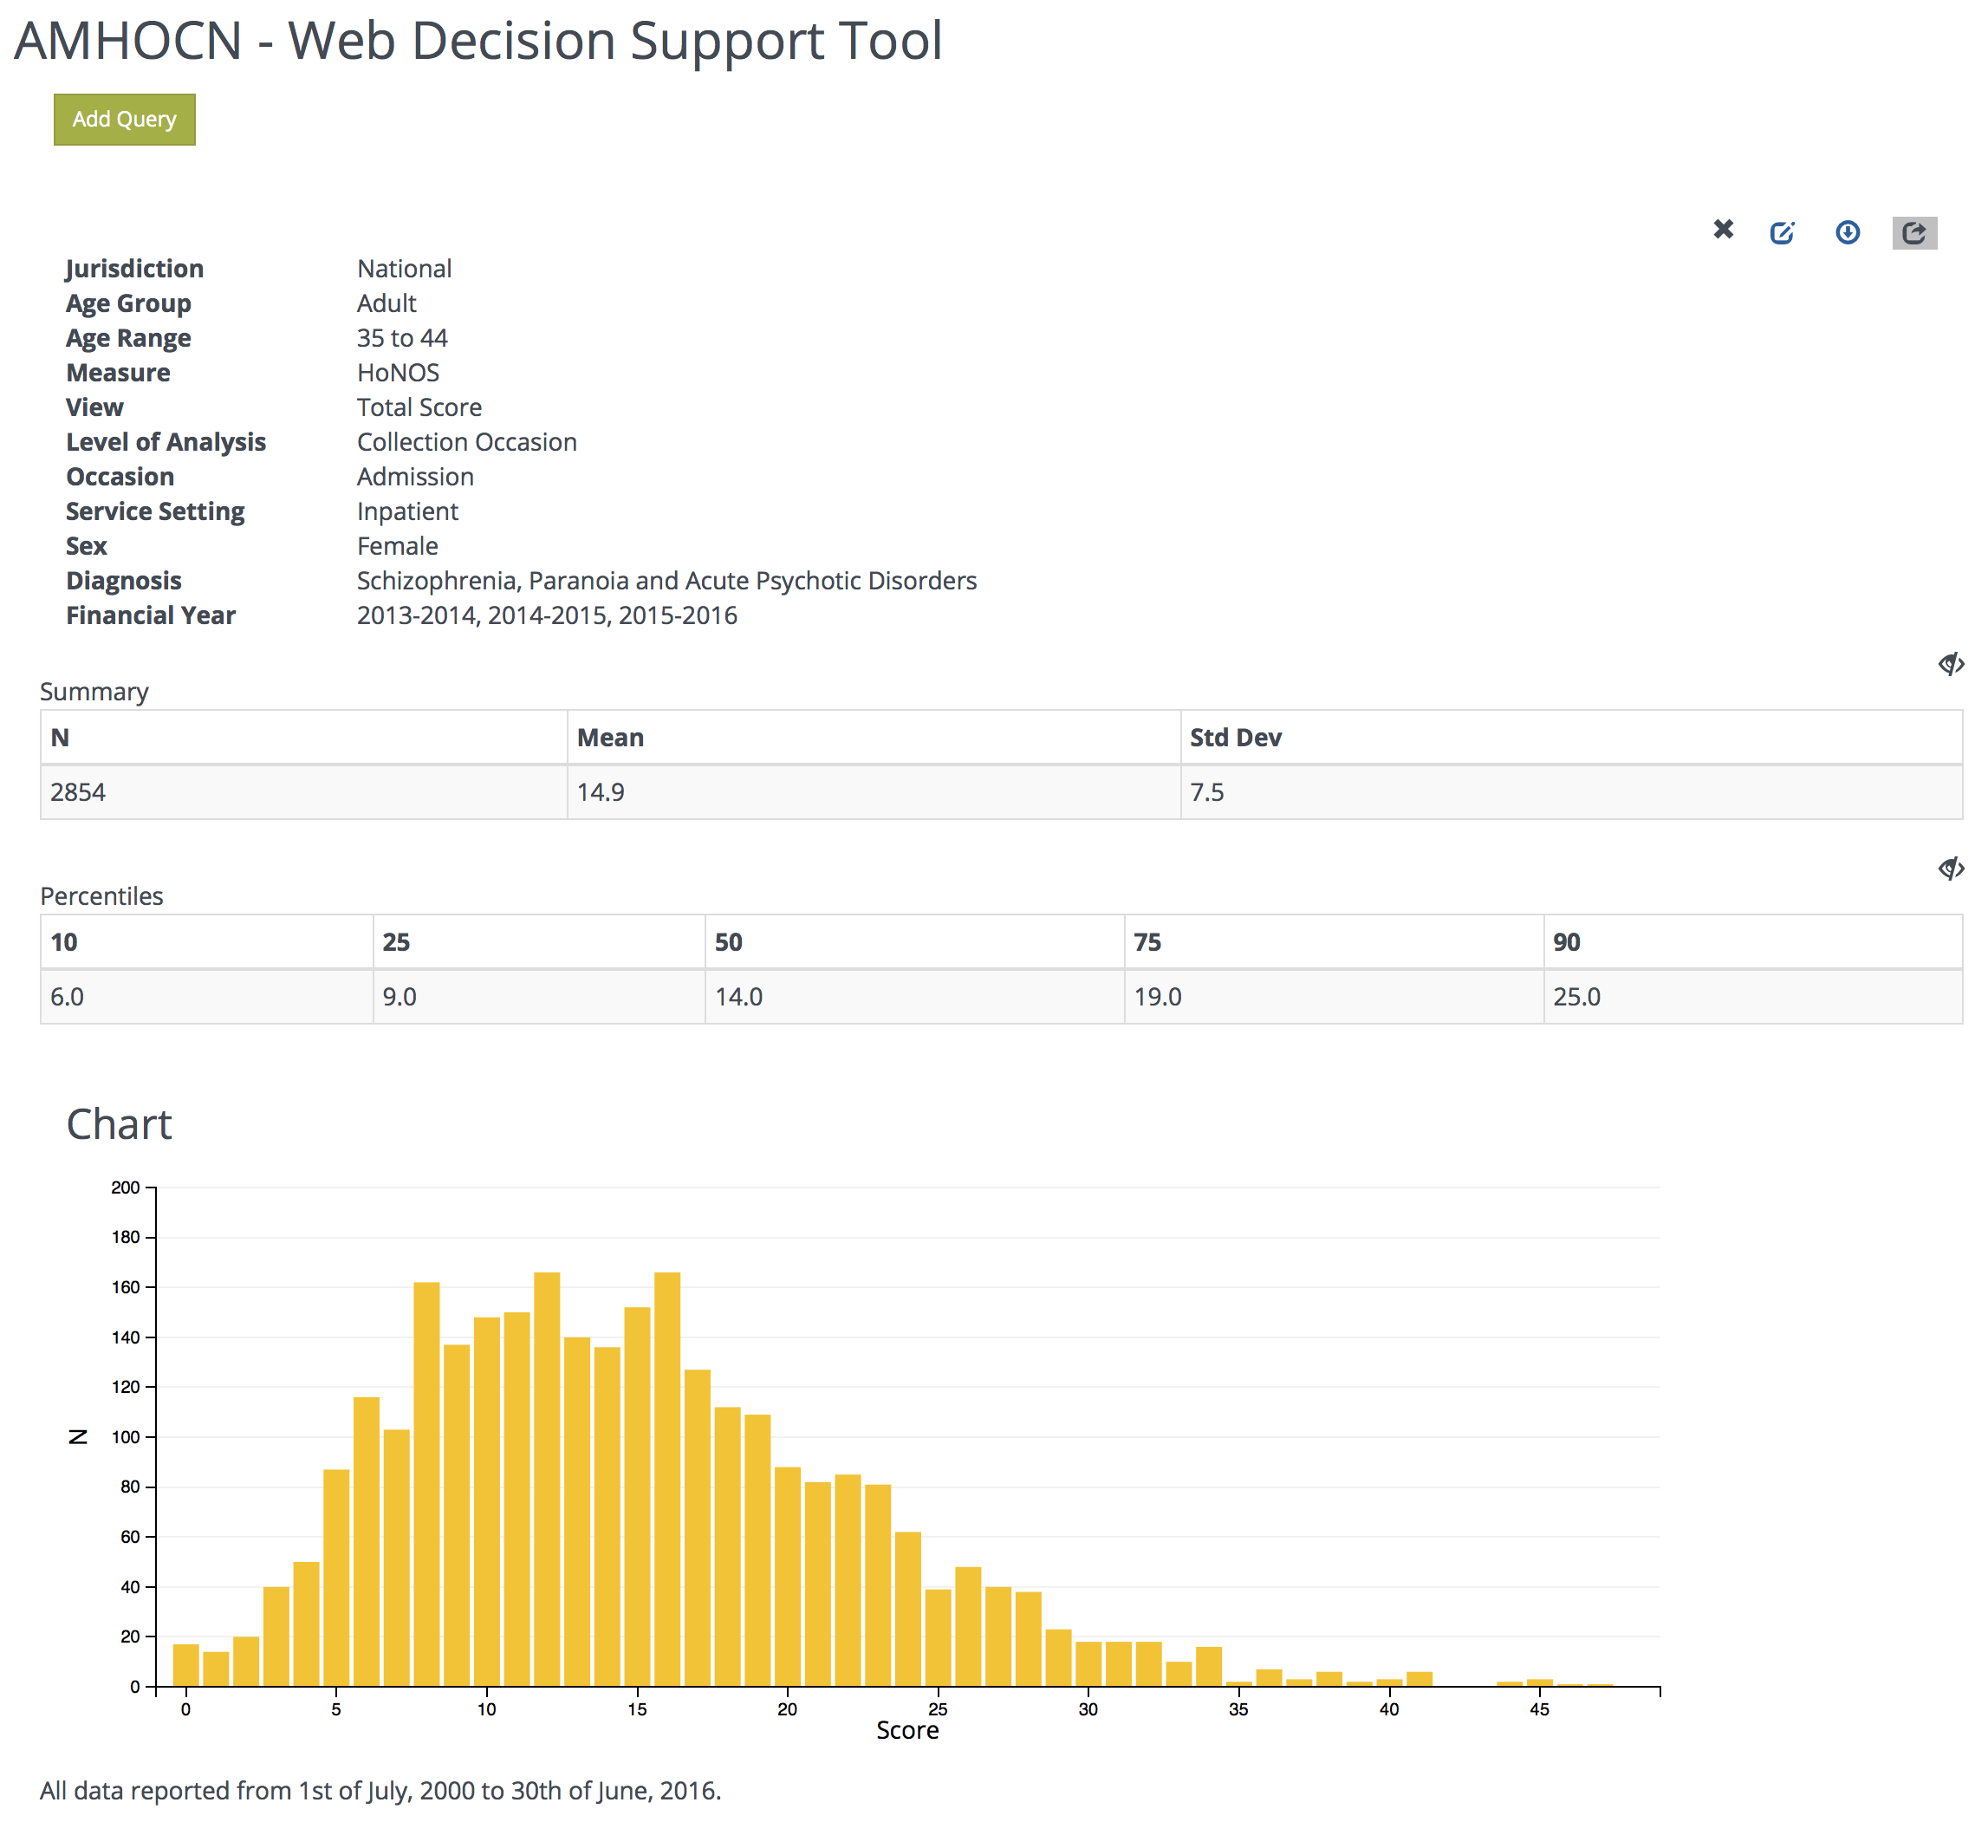
This tells you that there are 2,854 valid observations for female consumers aged 35-44 with a diagnosis of schizophrenia, paranoia and acute psychotic disorders at admission to adult inpatient settings in the NOCC dataset at this time. The median HoNOS total score (that below which 50% of observations fall and above which 50% of observations fall) is presented under it’s alternate name: 50th Percentile. The value in this example is 14.0. Other percentiles are similarly displayed. The mean HoNOS total score for consumers like this, calculated by dividing the sum of the total scores by the number of observations, is 14.9. The standard deviation around this mean, which is a measure of variance, is 7.5.
Suppose that Kim’s total HoNOS score at admission is 20. Type ‘20’ into the blank white box after Individual Comparison Status Code, and click ‘Enter’. You will see that the Percentile returned is 78.5, and you will also see her score represented on the histogram with her peers. The chart in the result should look like this:
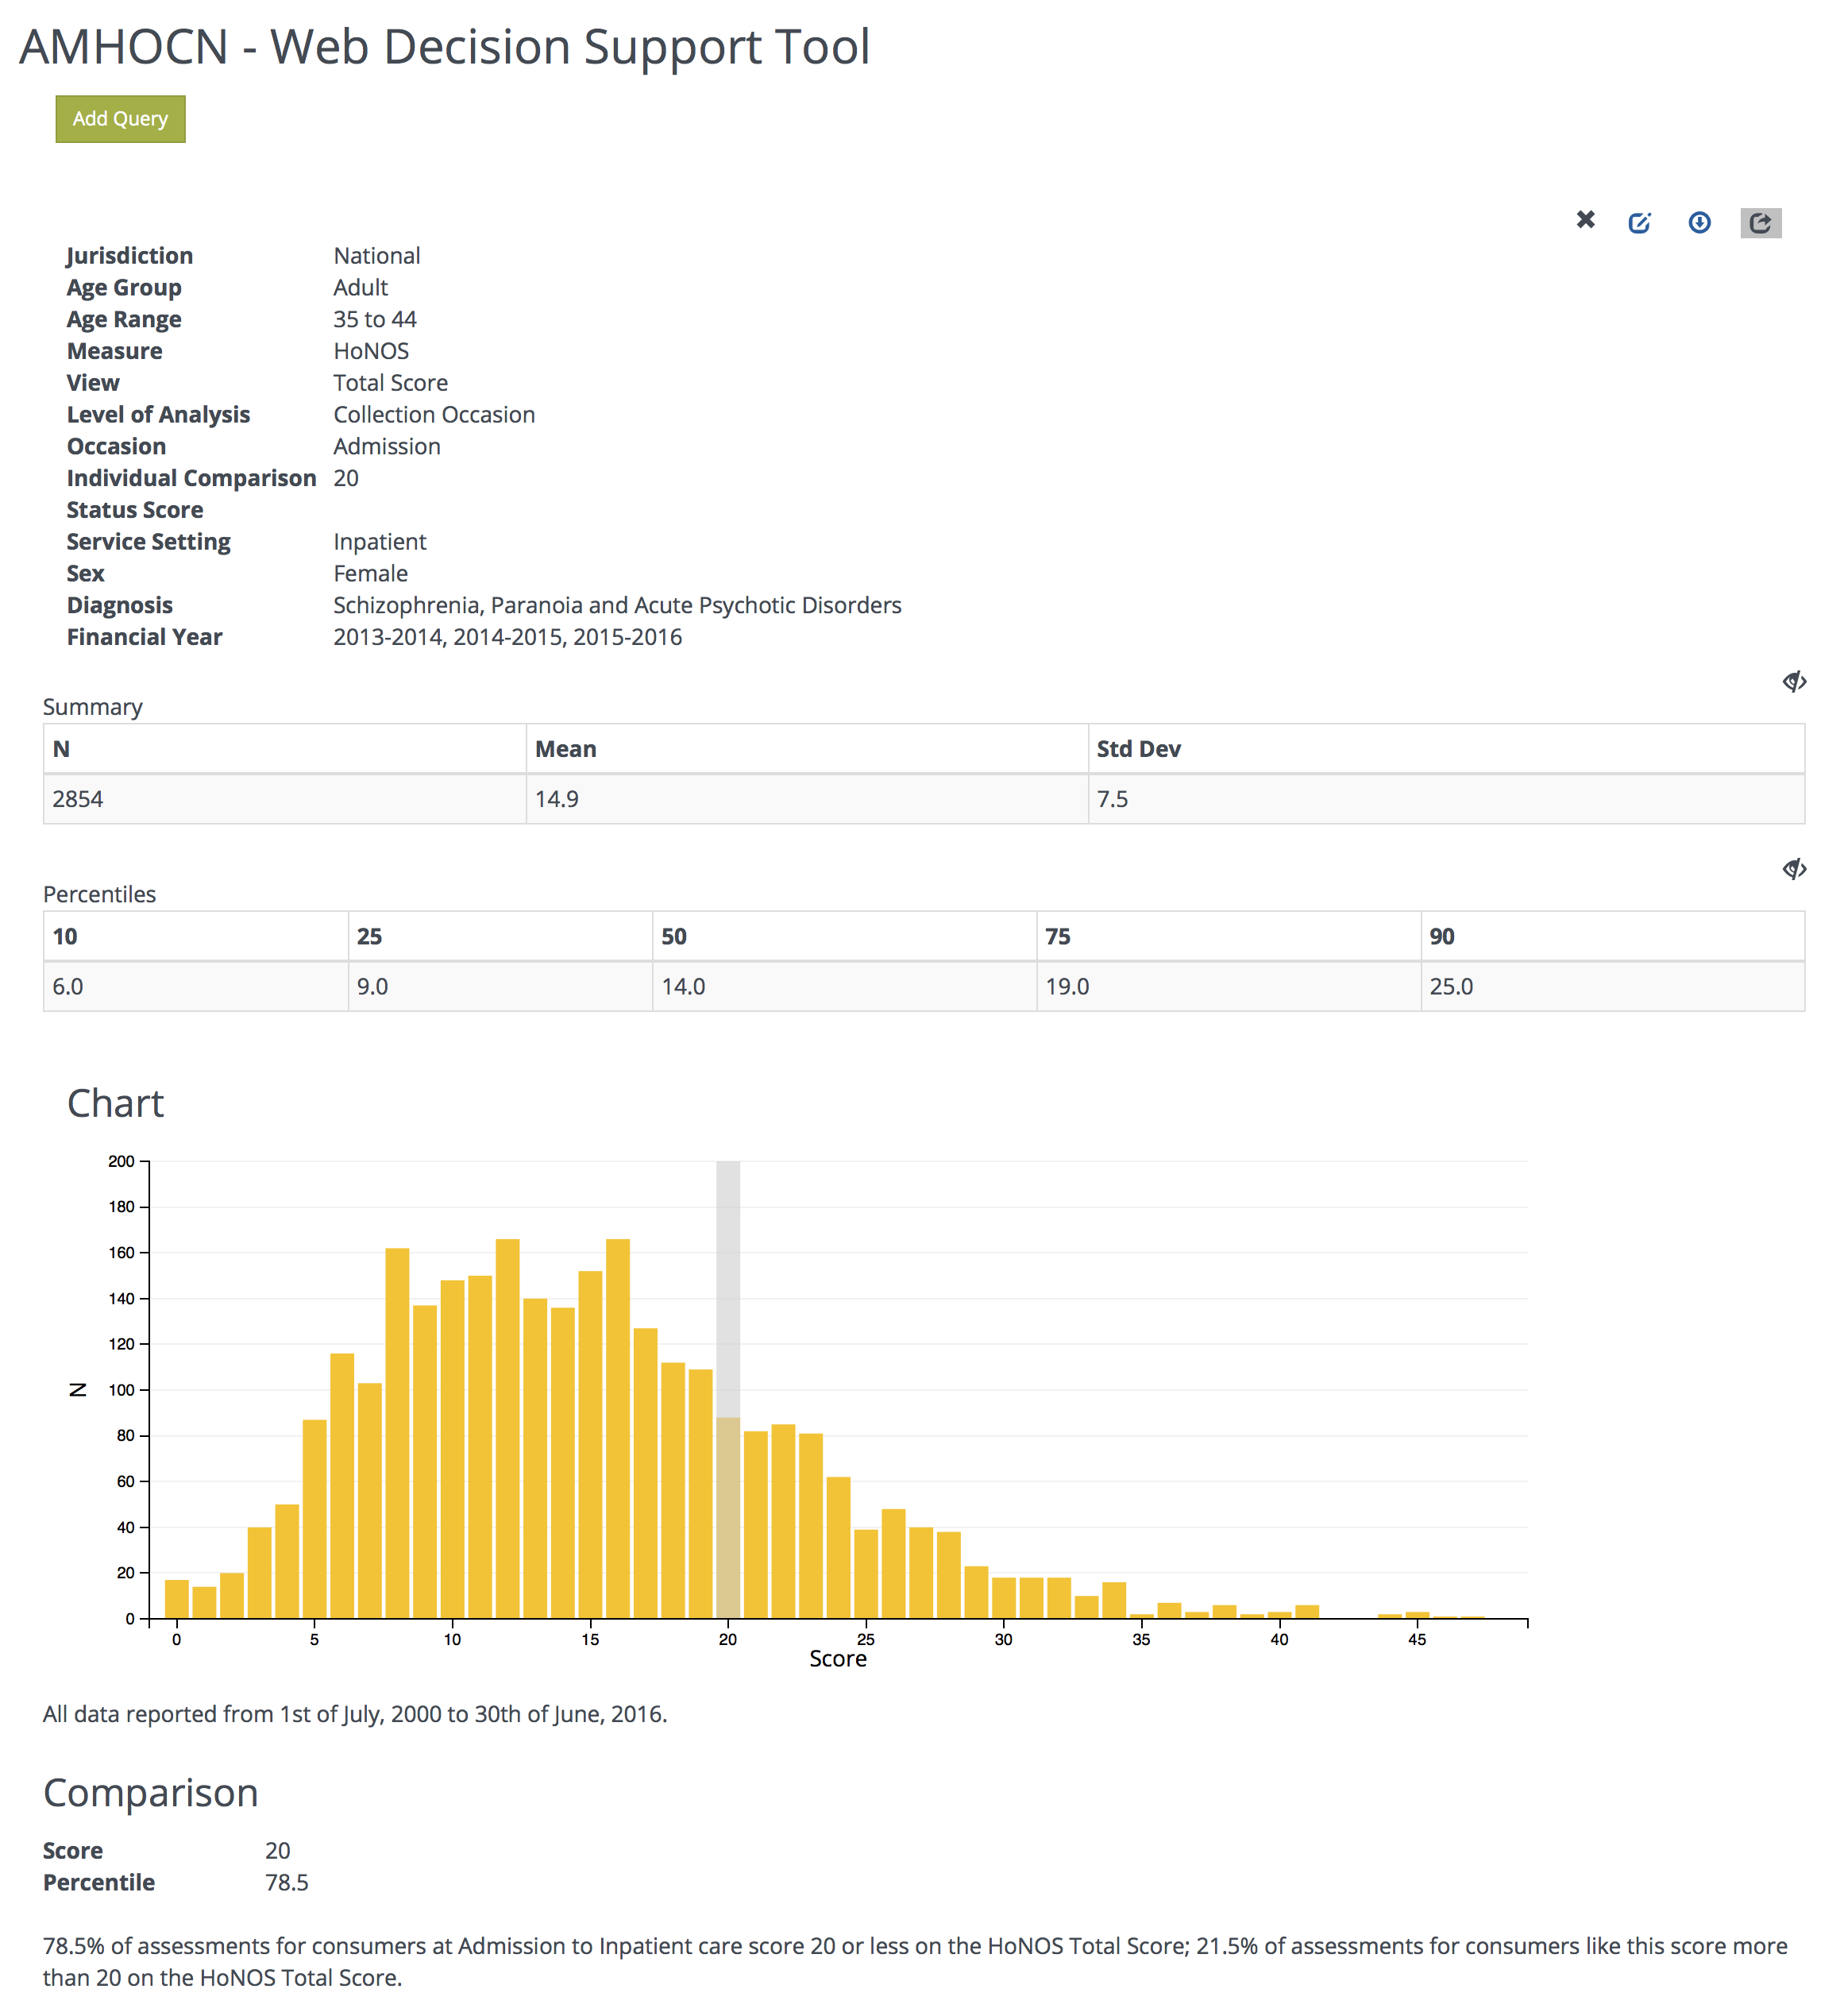
Below the chart, you can see a description describing Kim’s score on this measure compared to all similar consumers.
As the text that follows the histogram says, 78.5% of assessments for female consumers with the same age, gender and diagnosis as Kim’s across the country score 20 or less on the HoNOS at admission to an inpatient setting; 21.5% of assessments for similar consumers score more than 20. So, Kim’s assessment is in the top 21.5% of all similar consumers in terms of severity. The histogram itself shows this information pictorially, demonstrating with the grey bar the point at which Kim’s score falls relative to the distribution of scores for all consumers with similar characteristics. The grey horizontal bars with numbers to the left and the right give you a guide as to the number of observations that make up each bar on the chart.
Supposing that you were interested in how Kim’s scored on the Behavioural Problems Subscale. First, click the “Edit Query” icon in the upper right of the query. When the query form appears, clear the value of 20 from the Individual Comparison Status Score box, then select ‘Behavioural Problems Subscale’ from the View drop down box, leaving all other partition and stratification settings intact.
Click ‘Run query’. You should then see a screen like this:
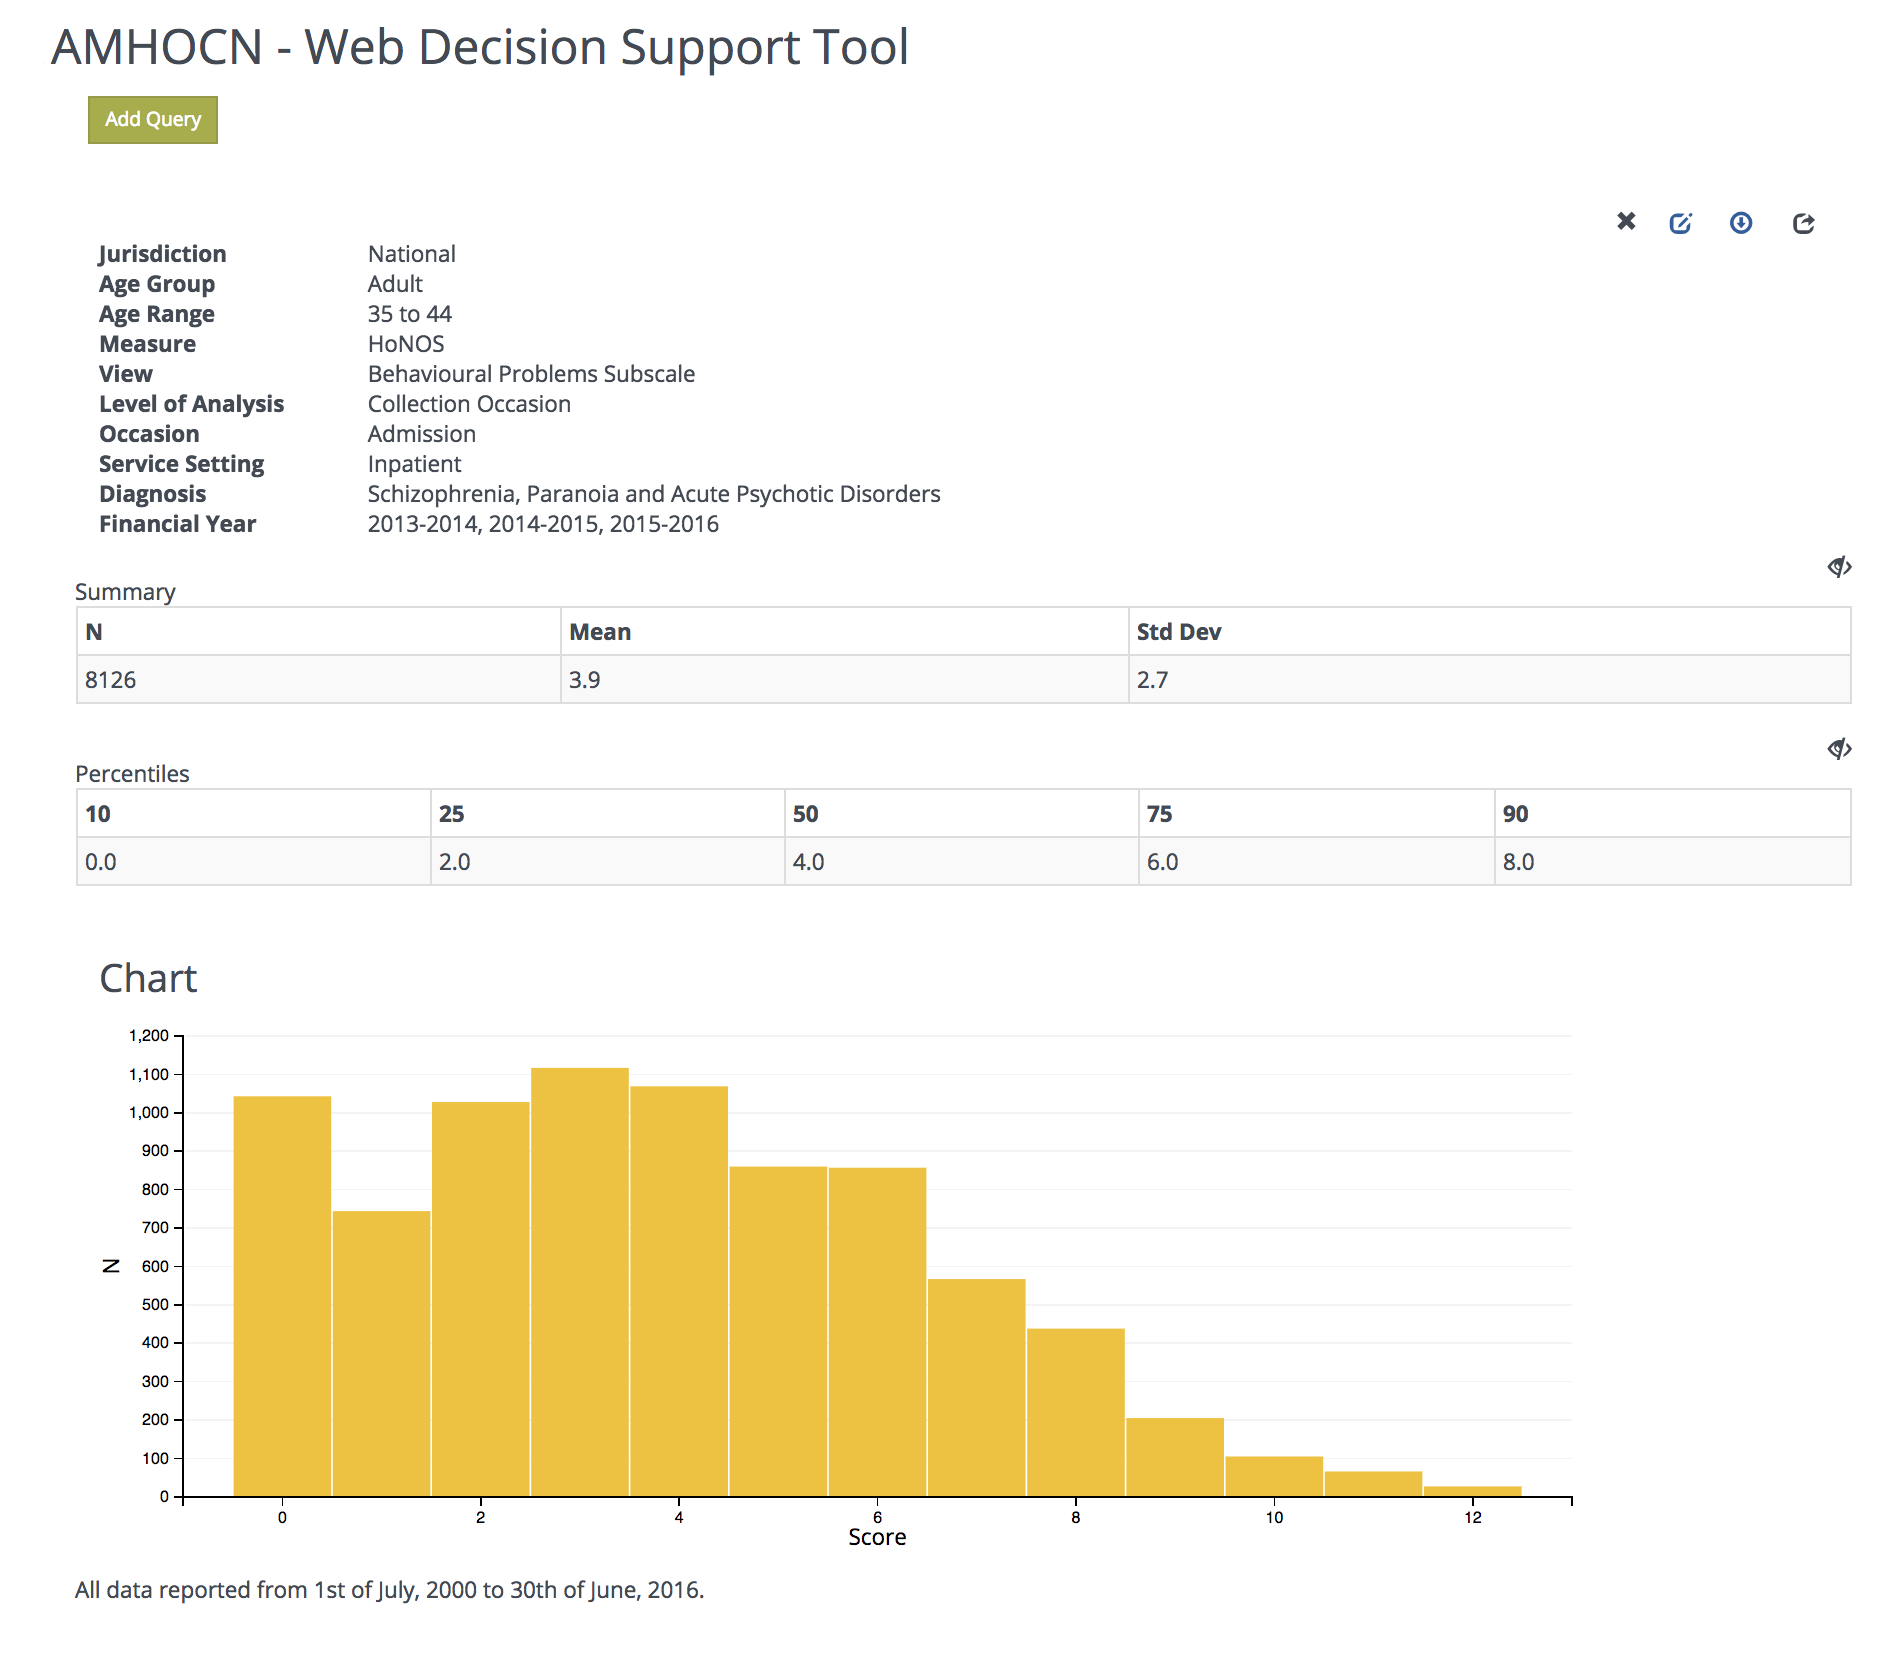
Again, you can enter Kim’s status score on this Subscale to compare with the national aggregate. Similarly, you can explore the remaining three subscales of the HoNOS as well as each of the individual 12 items.
Example 2: Change in mental health status
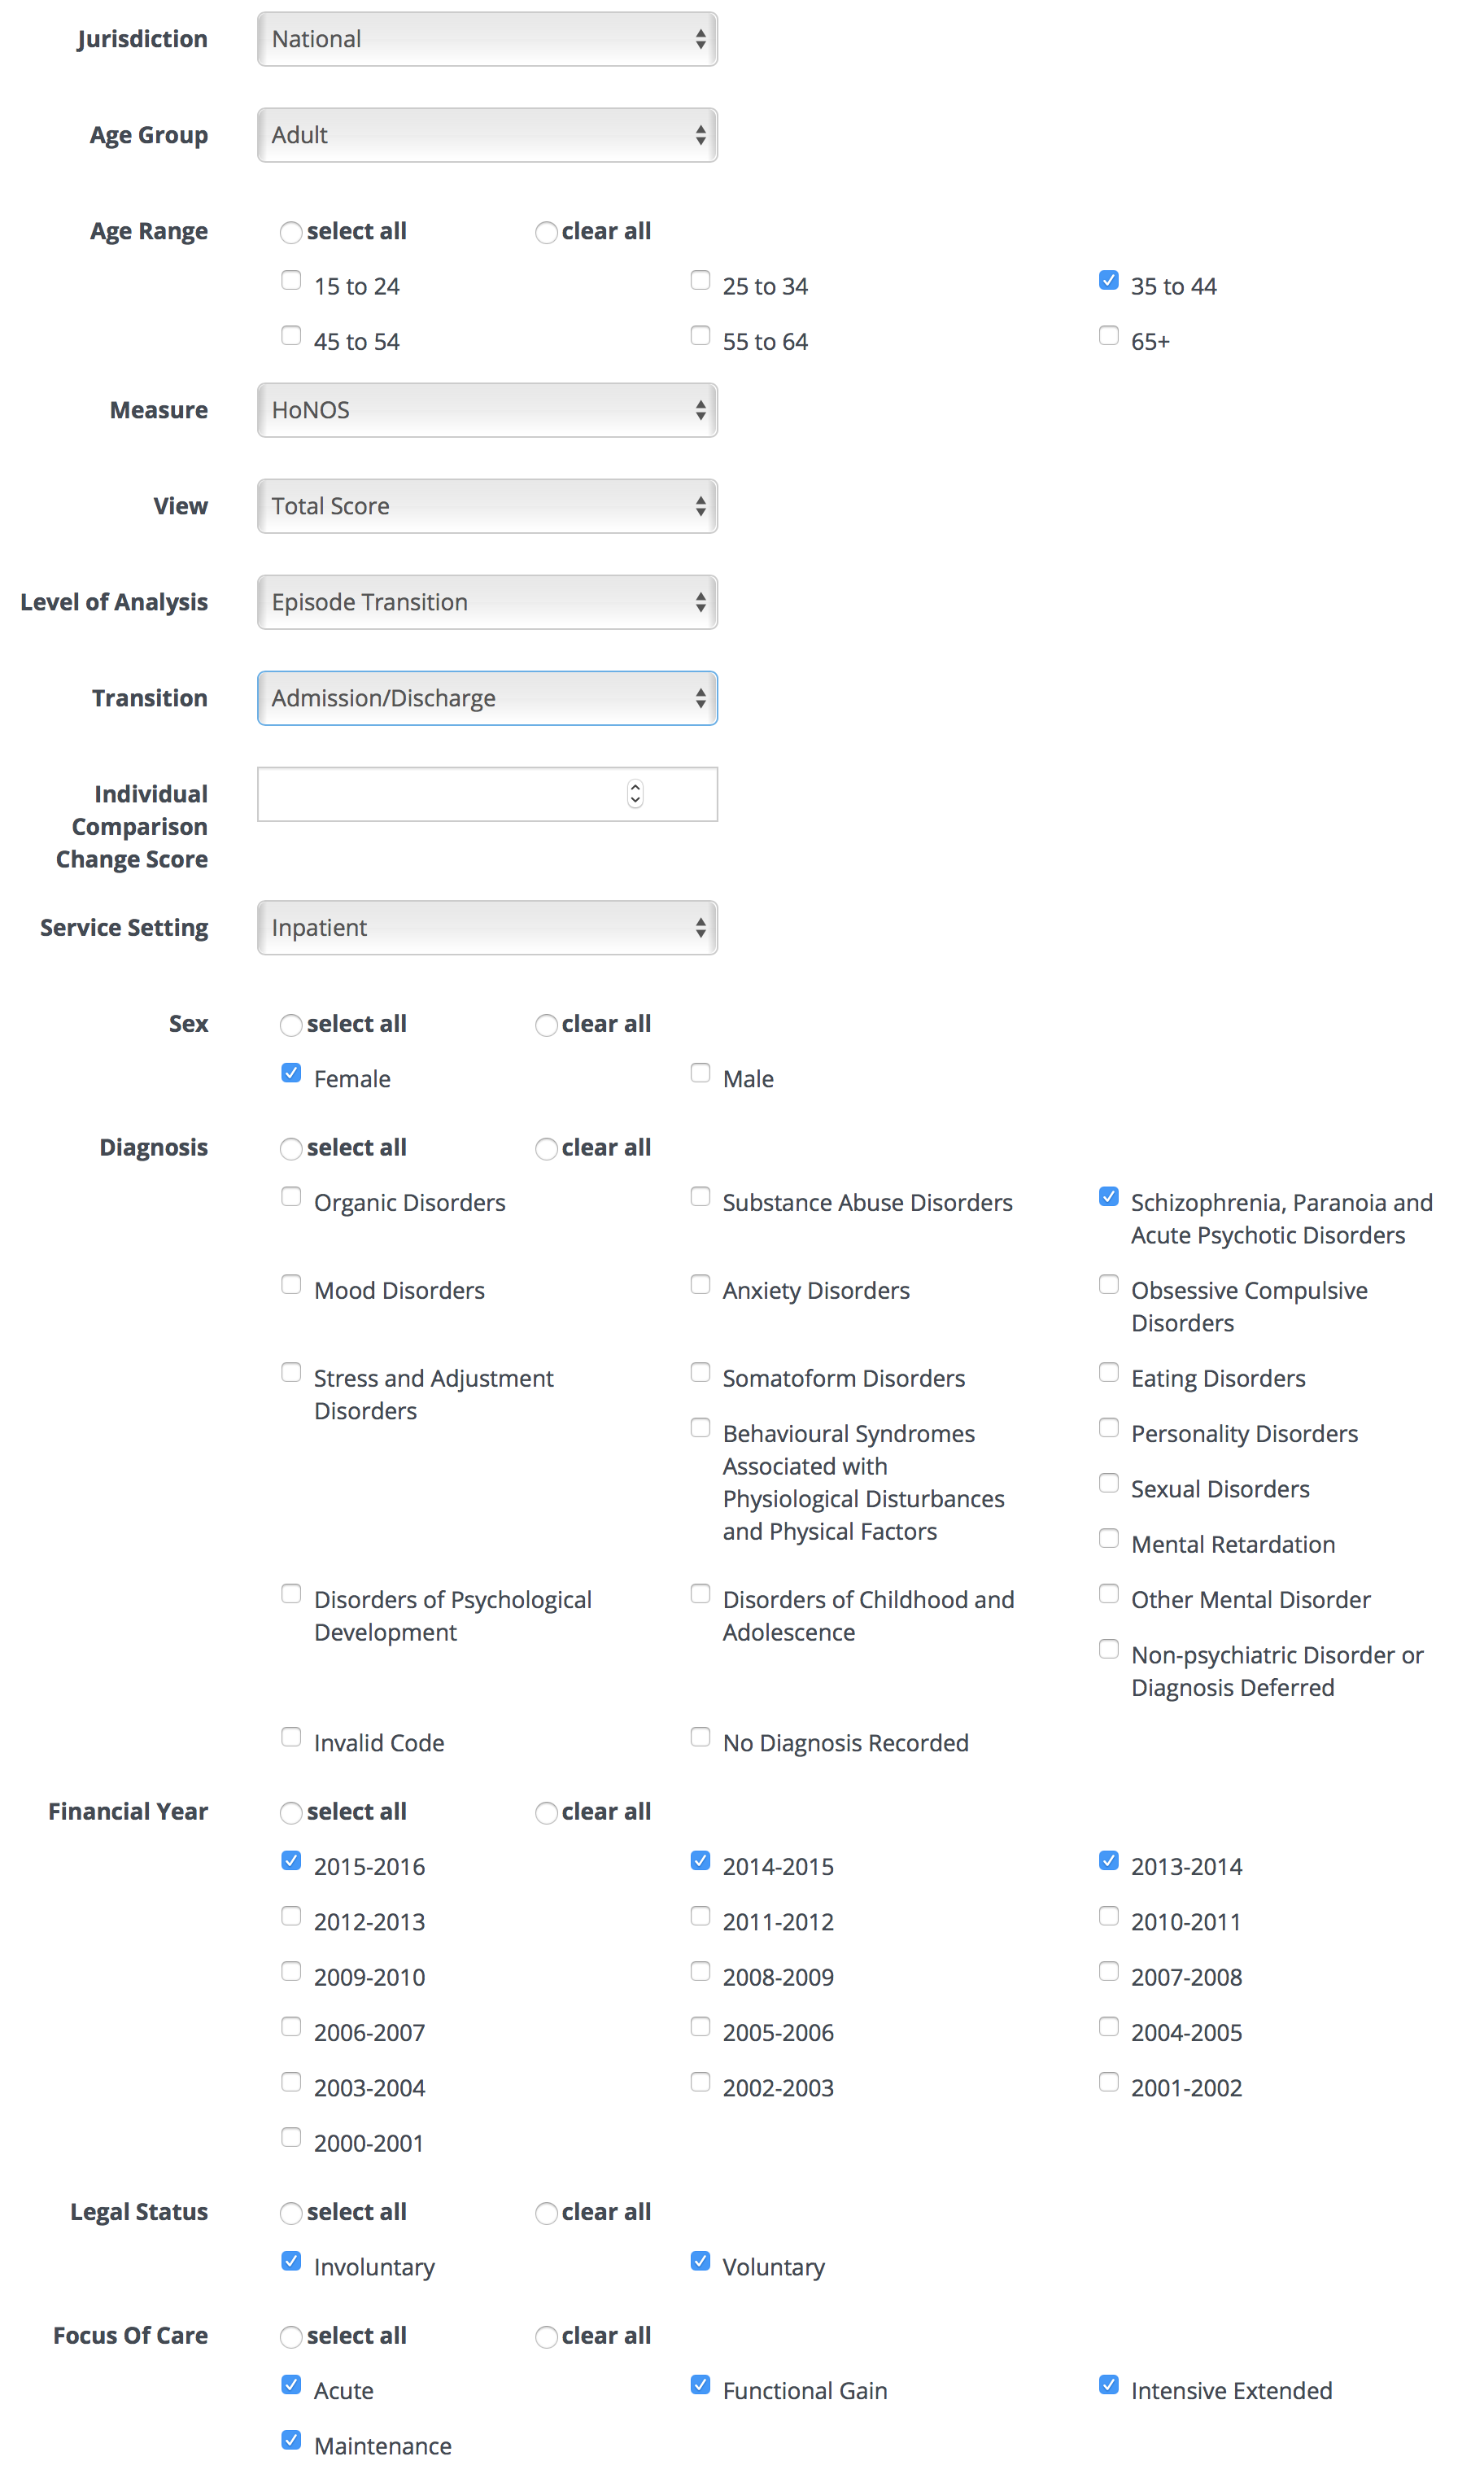
You successfully treat Kim during her inpatient stay. At discharge, Kim has a HoNOS total score of 6. Remembering that her admission score was 20, this means that her change score is 14. You can determine how this level of change compares with the norm, by changing the parameters on the WDST to consider change scores, rather than mental health status. To do this, click the “Edit query” icon, then change Level of Analysis to Episode Transition and View to Total Score. You will notice that this results in the Occasion box being replaced by the Transition box. You are interested in how Kim’s transition from admission to discharge compares with that of her peers, so select Admission/Discharge. The screen should now look like something this:
The results:
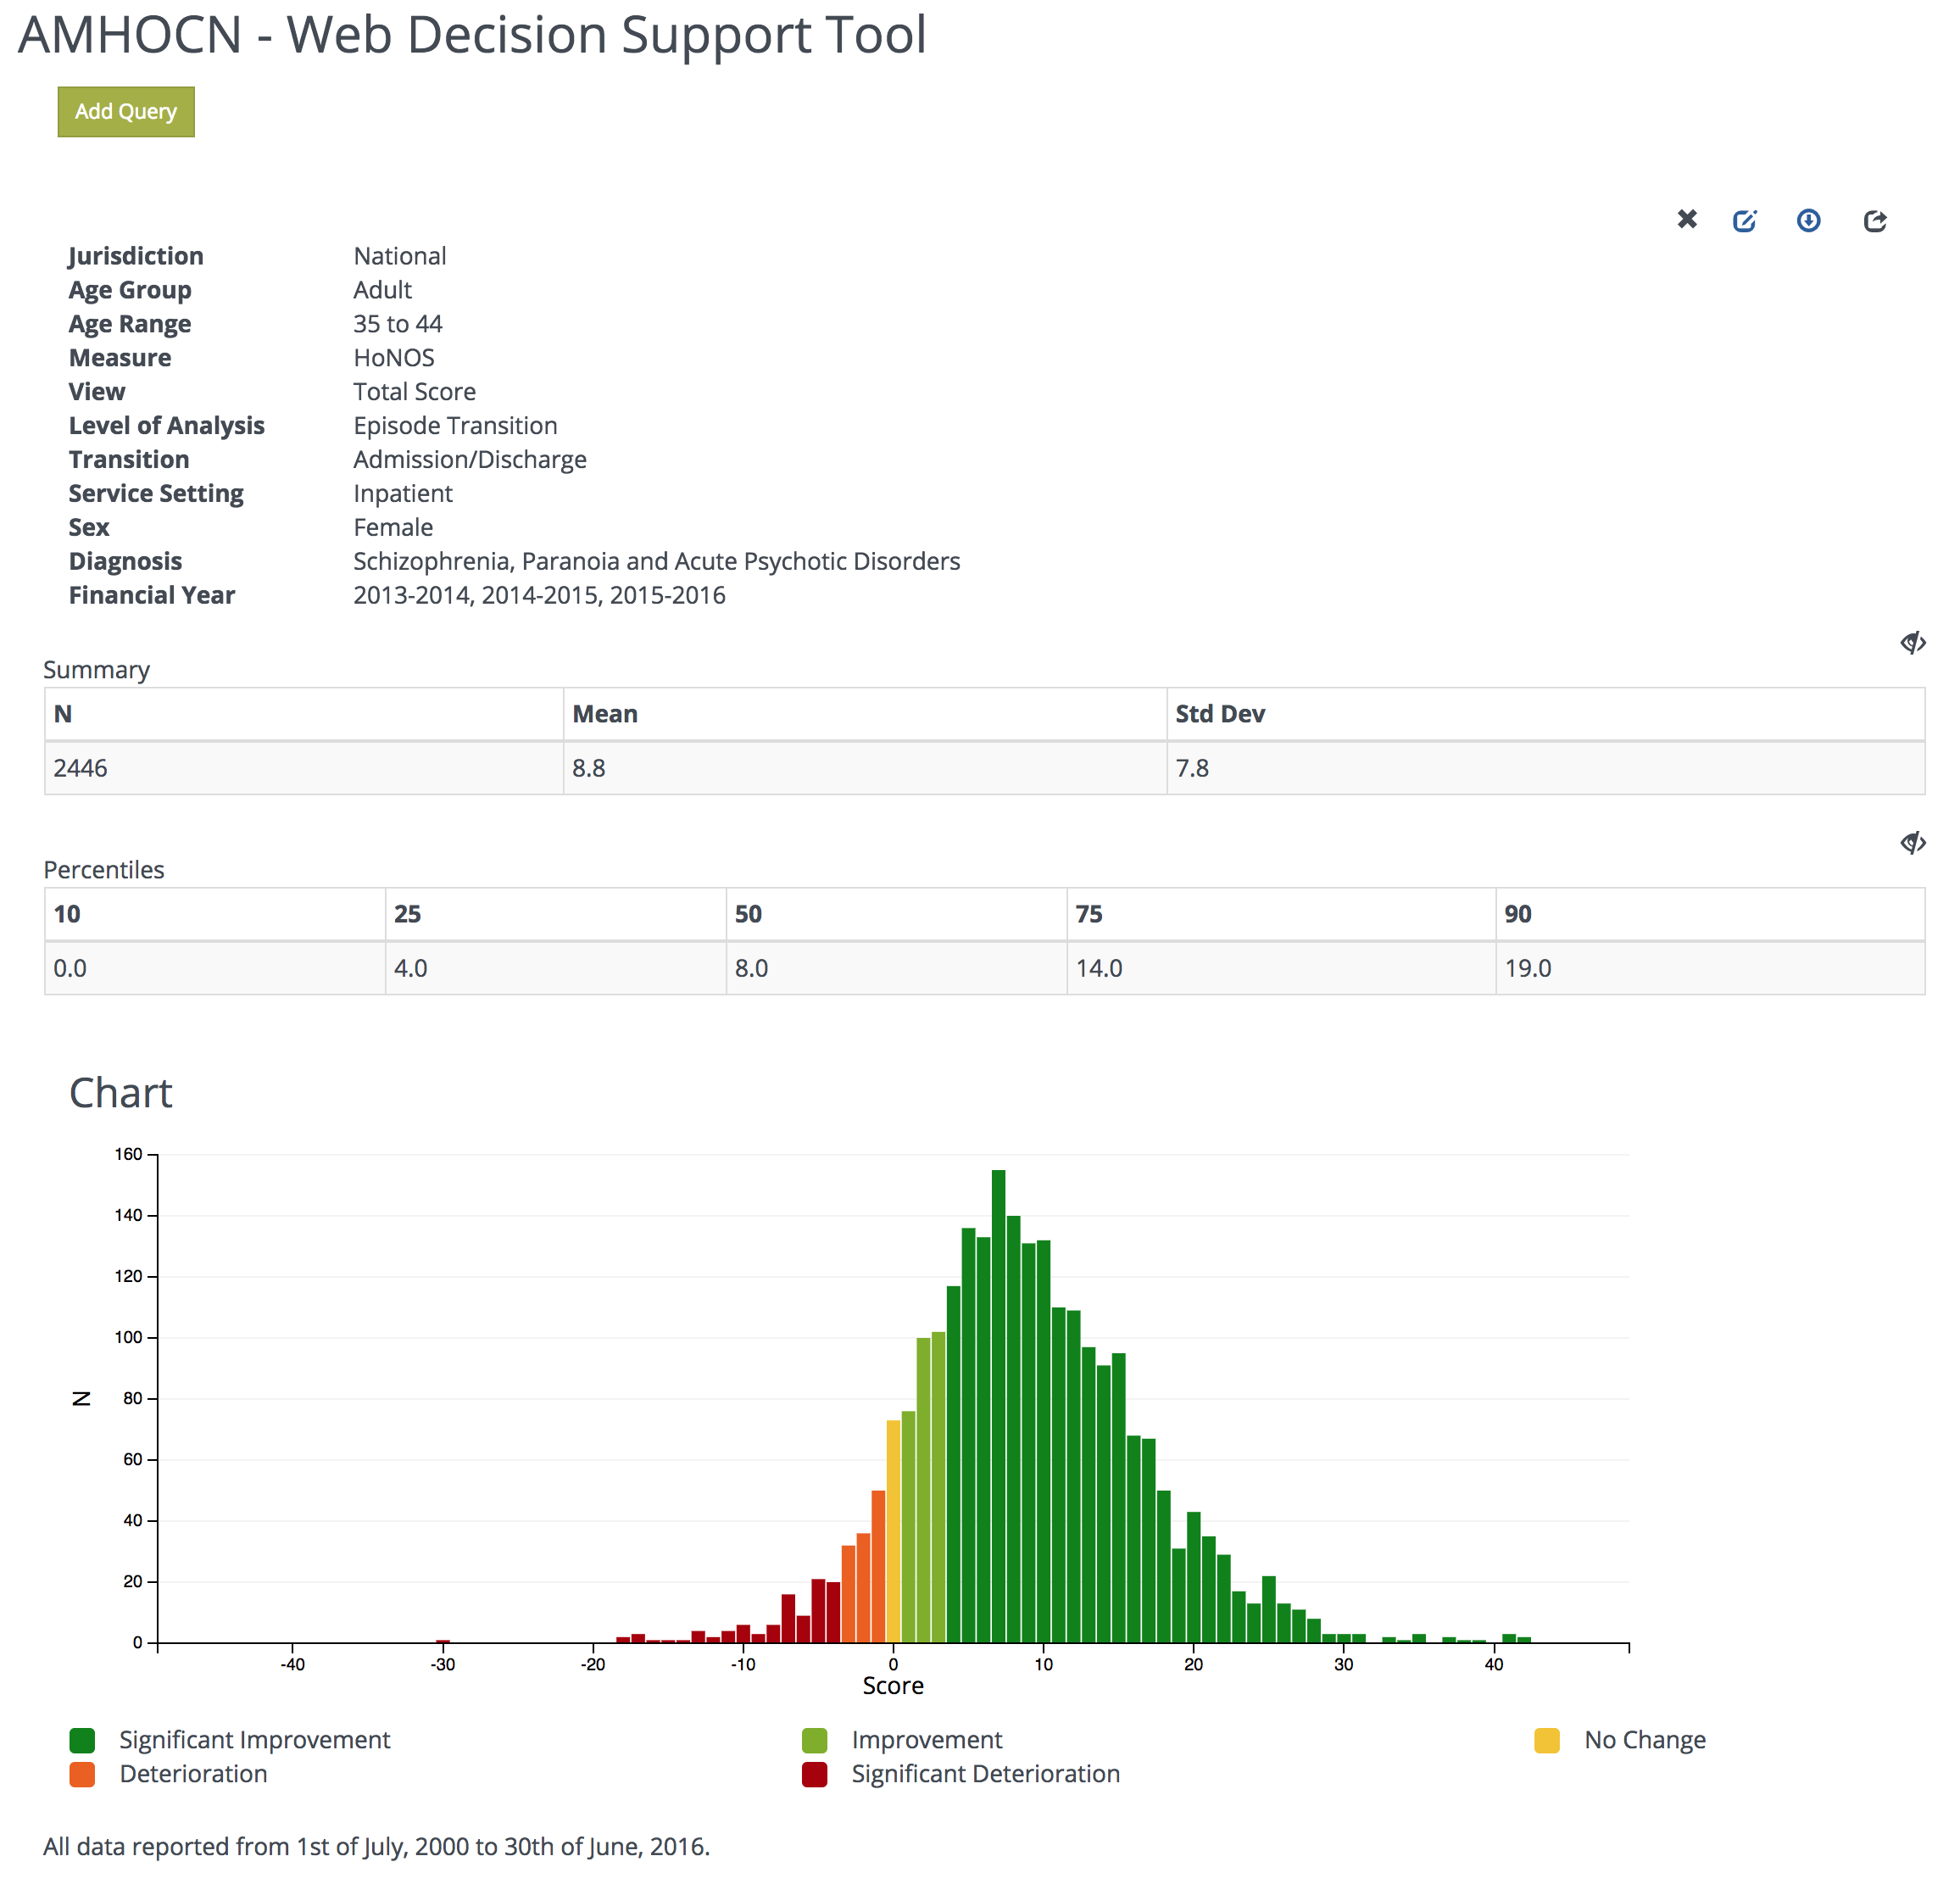
If you look at the change score statistics that are generated for consumers like Kim, you will see that there are 2,446 observations contributing to the analysis, that the median HoNOS total change score is 8.0 (this is indicated as the 50th percentile). This is interpreted as 50% of these consumers experience greater improvement than a change of 8.0, and 50% experience less improvement. The mean change score is 8.8 and the standard deviation is 7.8.
To examine how Kim’s HoNOS total score compares with this overall picture, click the “Edit query” icon and type 14 (Kim’s change score) into the ‘Individual Comparison Change Score’ box, and click “Run Query”.
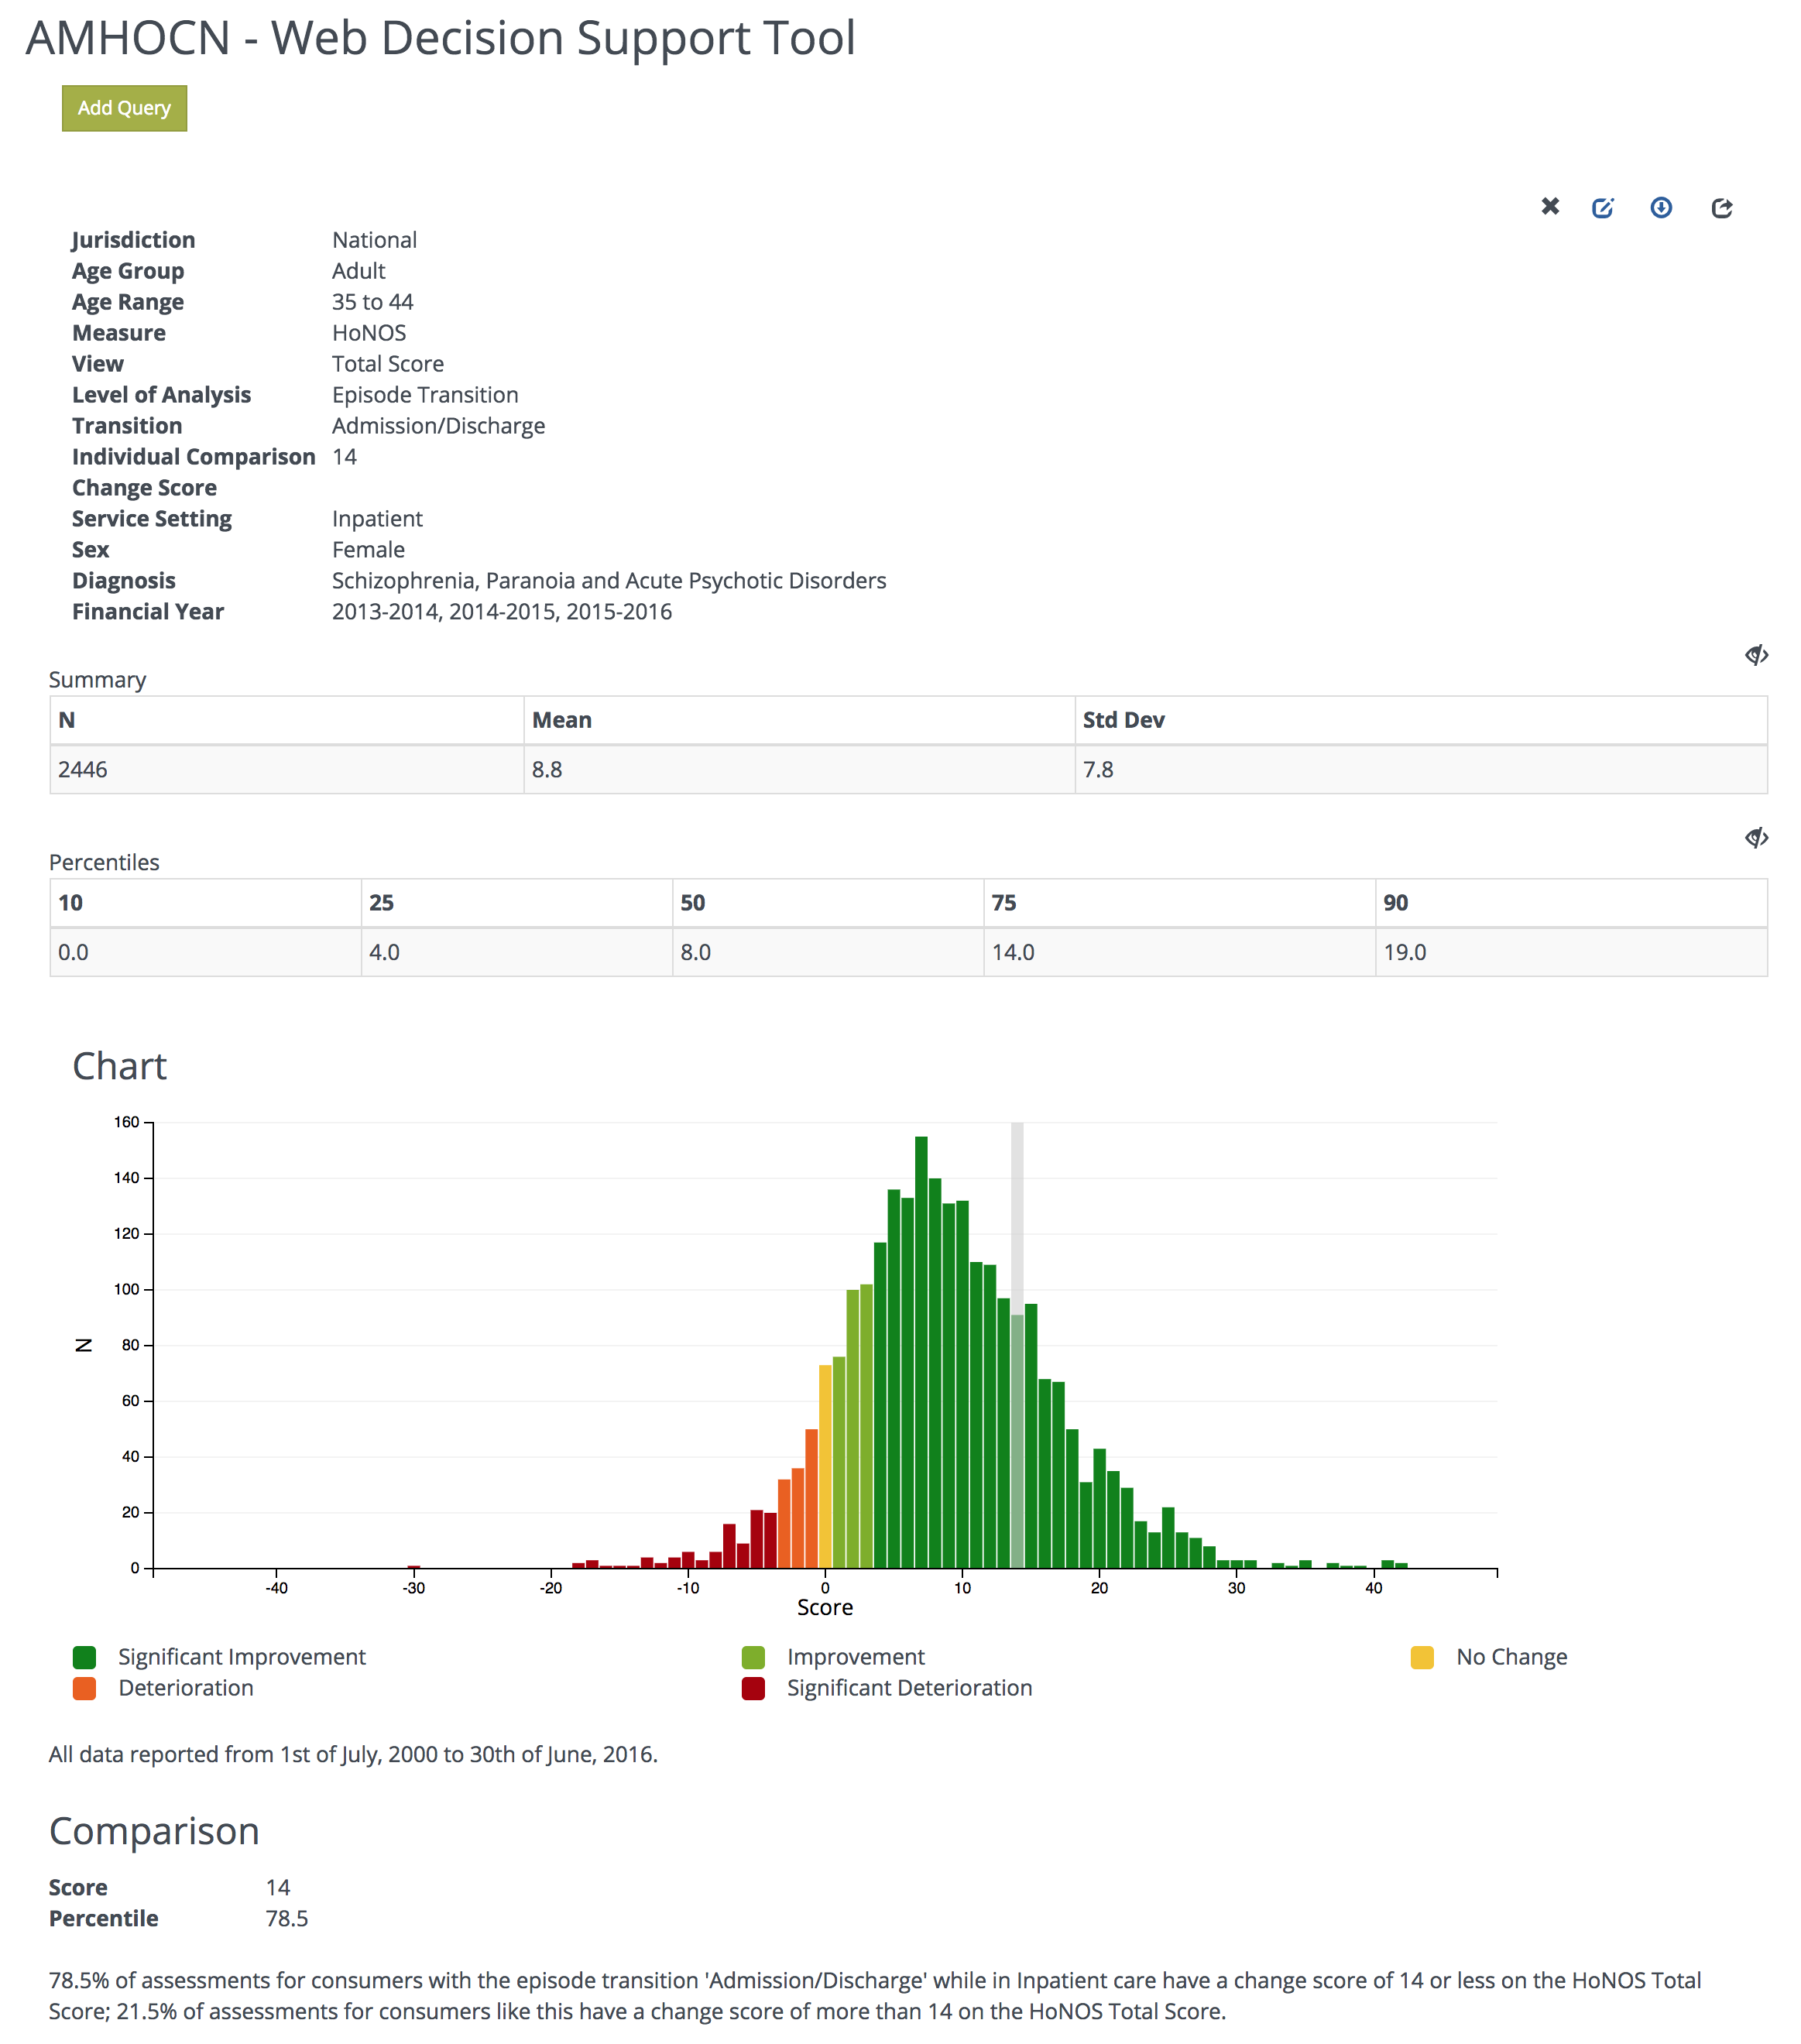
You will see that Kim rates in the 78th percentile so, as the text below the histogram says, 78.5% of consumers like Kim shift 14 points or less on the HoNOS between admission and discharge from an inpatient setting, and 21.5% have a change by more than 14 points. In other words, Kim’s improvement is well above average.